Marketing Reporting for Executives: How to Show Results Your CEO Will Understand and Trust
The report is twenty slides long: click-through rate, reach, new followers and a traffic chart. The CEO flips through it and asks one question: did we make money on this? If the first sentence of the report doesn’t answer that, no chart will save it. Here is how to present marketing results to leadership on one page, which metrics belong in it, how to calculate return without dressing it up and how to be upfront about what can’t be measured.
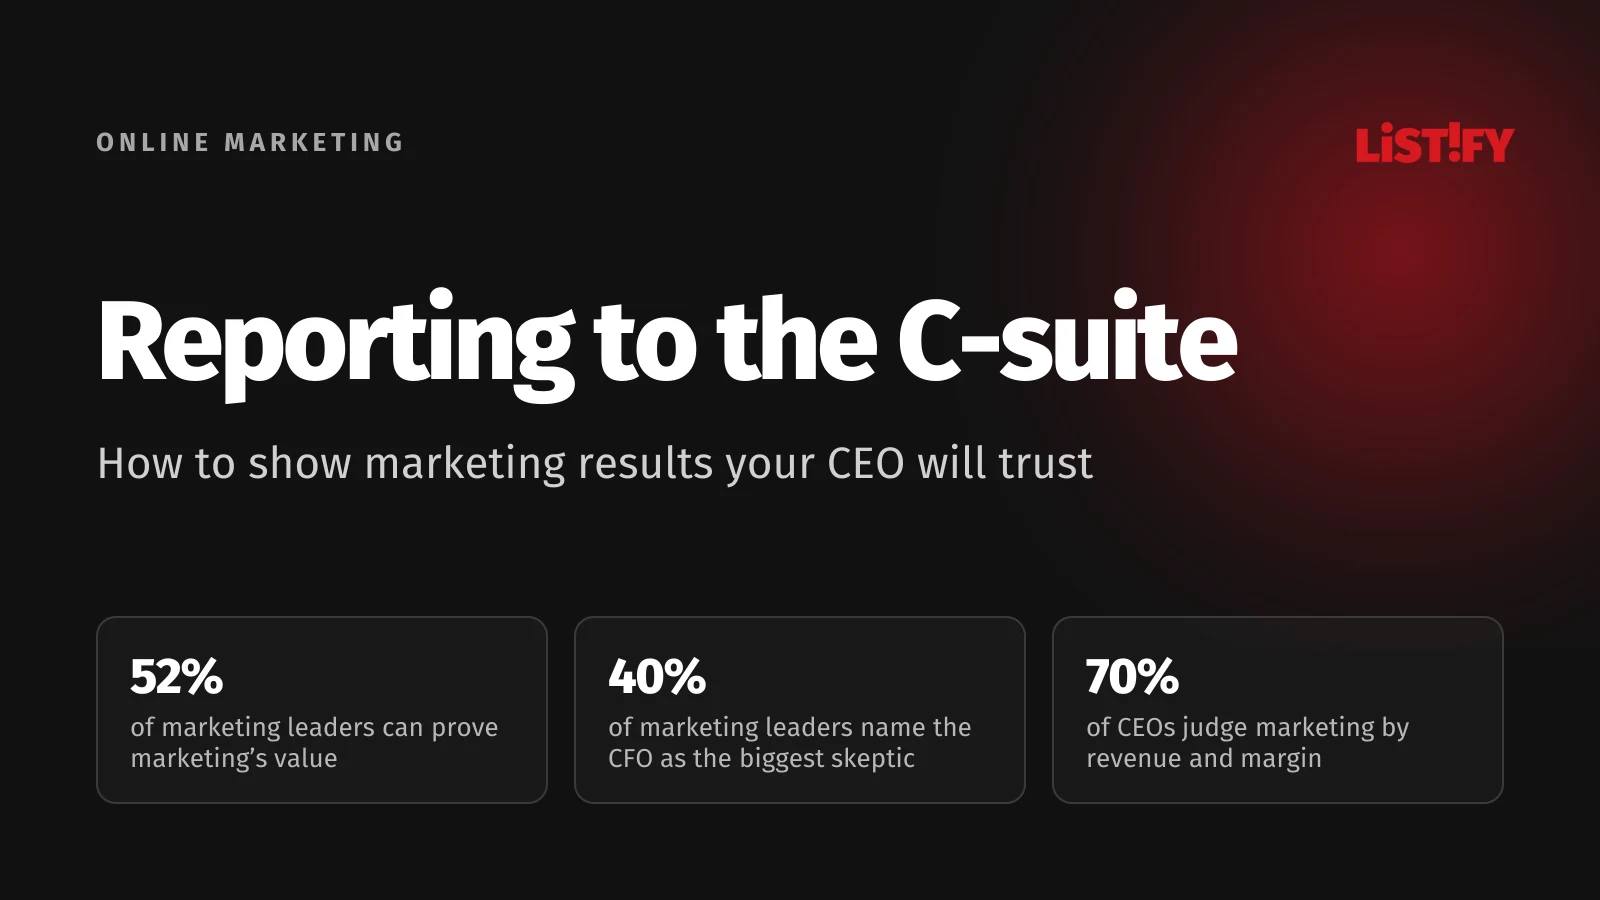
A marketing report for leadership has one job: show what the company got for the money it put into marketing and help decide what to do next. Yet most reports stop at numbers that mean something mainly to marketers. How many people saw the ad, how many of them clicked, how many new followers came in.
The gap is well documented. According to Gartner, only 52% of CMOs and other senior marketing leaders say they succeed in proving the value of marketing and getting credit for it. They named CFOs (40%) and CEOs (39%) as the executives most skeptical of marketing’s value. The survey of 378 senior marketing leaders ran in spring 2024. In fall 2024, The CMO Survey asked 260 US marketing leaders how they show the impact of marketing spend. 54.6% prove the short-term impact with numbers, but only 41.8% can do the same for the long term. The rest have only a qualitative sense of the impact, or can’t show it yet.
- Confident they can measure ROI (Nielsen)85.0%
- Prove short-term impact with numbers (CMO Survey)54.6%
- Prove value and get credit (Gartner)52.0%
- Prove long-term impact with numbers (CMO Survey)41.8%
- Measure digital and traditional together (Nielsen)32.0%
- Same, Europe only (Nielsen)23.0%
The figures come from three surveys with different samples. The chart shows the gap between confidence and proven results. Sources: Nielsen 2025, 1,400 marketers with budgets of at least $1 million; The CMO Survey, fall 2024, 260 US companies; Gartner 2024, 378 senior marketing leaders.
Nielsen’s numbers sum up the problem: 85% of marketers are confident they can measure ROI, while only 32% actually measure digital and traditional media together. A report built on traffic and reach answers a question leadership never asked.
If social media is your main concern, our guide on how to measure social media success goes into detail.
01Why executives don’t read marketing reports
Marketing and leadership often look at different numbers. In 2024, McKinsey gathered views from about a hundred C-suite executives at Fortune 1000 companies. According to a summary of the study in Chief Marketer, 70% of CEOs judge marketing by year-over-year revenue growth and margin, while only 35% of CMOs track that as a top metric. McKinsey partner Robert Tas, a co-author of the report, put it this way: “CMOs have all these amazing customer metrics and everything’s measurable, and it’s almost overwhelming for the CEOs and the C-suite to be able to grasp it.”
Then there is the view of marketing as a cost. In a separate Gartner survey of 395 CMOs from the same year, 47% said marketing is viewed as an expense rather than a strategic investment. When leadership sees a cost, it reads the report like an invoice: what did this cost, and can we cut it? The CMO Survey 2026 shows what that means in practice at US companies. When profits fall short and executives turn to cutting costs, marketing is the first thing cut 45.4% of the time. Pressure to prove marketing’s value is still high, even if it eased a little from 2025.
- From the CEO2025: 61%2026: 59%
- From the CFO2025: 63%2026: 56%
- From the board2025: 50%2026: 45%
Share of marketing leaders who report increasing pressure to prove the value of marketing. Source: The CMO Survey 2026, 308 US companies, fielded in January 2026.
What helps is swapping the numbers leadership never asks about for the ones it does. The table shows typical metrics from marketing reports next to the questions executives ask about them:
| What marketing shows | What leadership asks | What to show instead |
|---|---|---|
| Reach and impressions | How many of those people could become customers? | New customers from the campaign |
| Click-through rate (CTR) | What does one customer cost us? | Customer acquisition cost (CAC) |
| New followers | Are people buying more, and more often? | Repeat purchase rate and revenue from existing customers |
| Search rankings | How much does the site bring in without paid ads? | Leads and revenue from organic search |
| Website traffic | Is it worth it? | Gross margin from sales minus marketing costs |
02The one-page report: what it has to include
A good report opens with the conclusion. The US Army calls this BLUF (bottom line up front), and its writing regulation.pdf) lists it as one of two essential requirements, along with the active voice. Consultant Barbara Minto built her Pyramid Principle on the same idea: one main point at the top, with the supporting arguments below it.
For a marketing report, that means the first sentence states the result, money included. Instead of “September was a strong month,” write “In September we spent $19,500 and won 90 new customers.” Below that come a few numbers with comparisons, an explanation and, at the end, the decision you need from leadership.
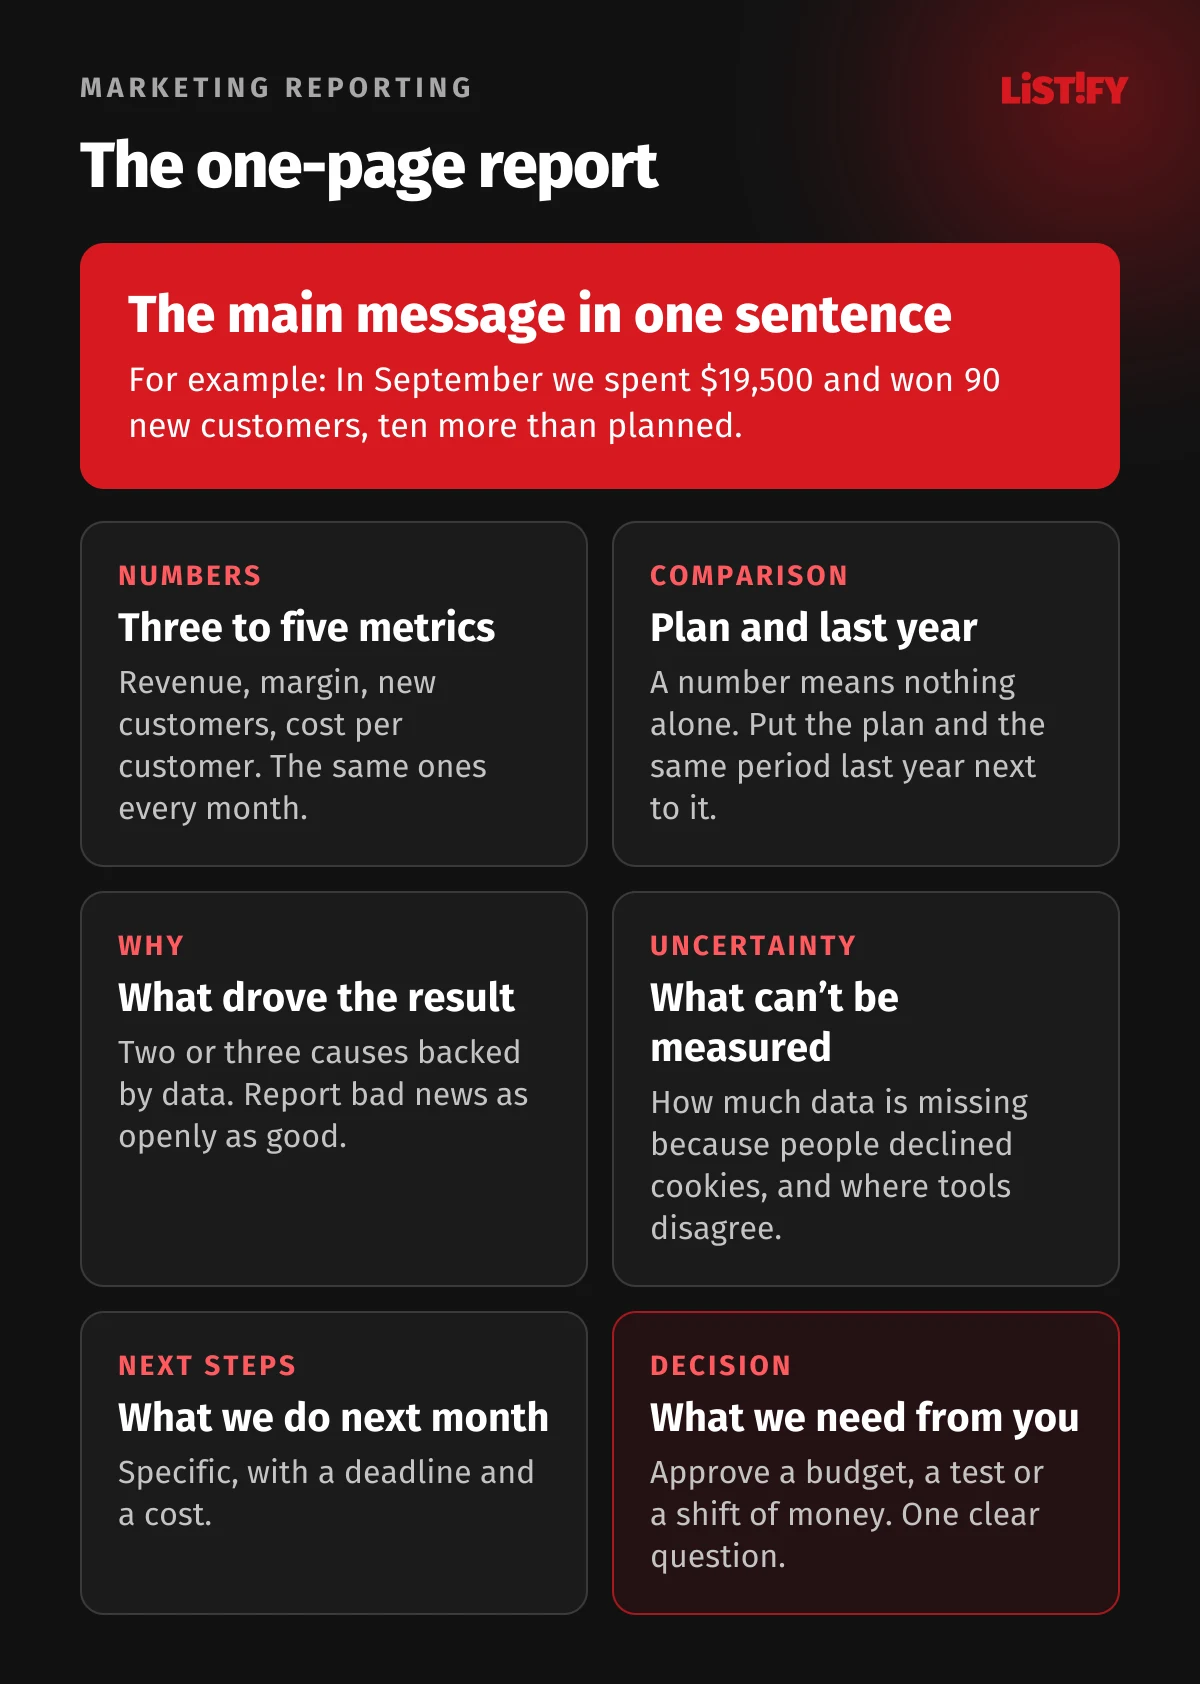
Pick three to five metrics and keep them the same every month, in the same order and with the same definitions. Leadership gets used to them and spots changes at a glance. Move detailed tables by campaign and channel to an appendix or a dashboard. Anyone on the leadership team who wants to dig deeper will find them there.
The last block matters most, and it is the one most reports leave out. If a report doesn’t end with a specific question for leadership, such as whether to approve moving $2,000 from one campaign to another, it is just information. Leadership then has no reason to read it closely.
03Metrics for leadership vs. metrics for the team
Marketing data forms a funnel. Impressions and clicks sit at the top, new customers, revenue and margin at the bottom. The upper stages change every day, and the team uses them to tune campaigns. Leadership cares about the lower stages, because only those can be set against costs.
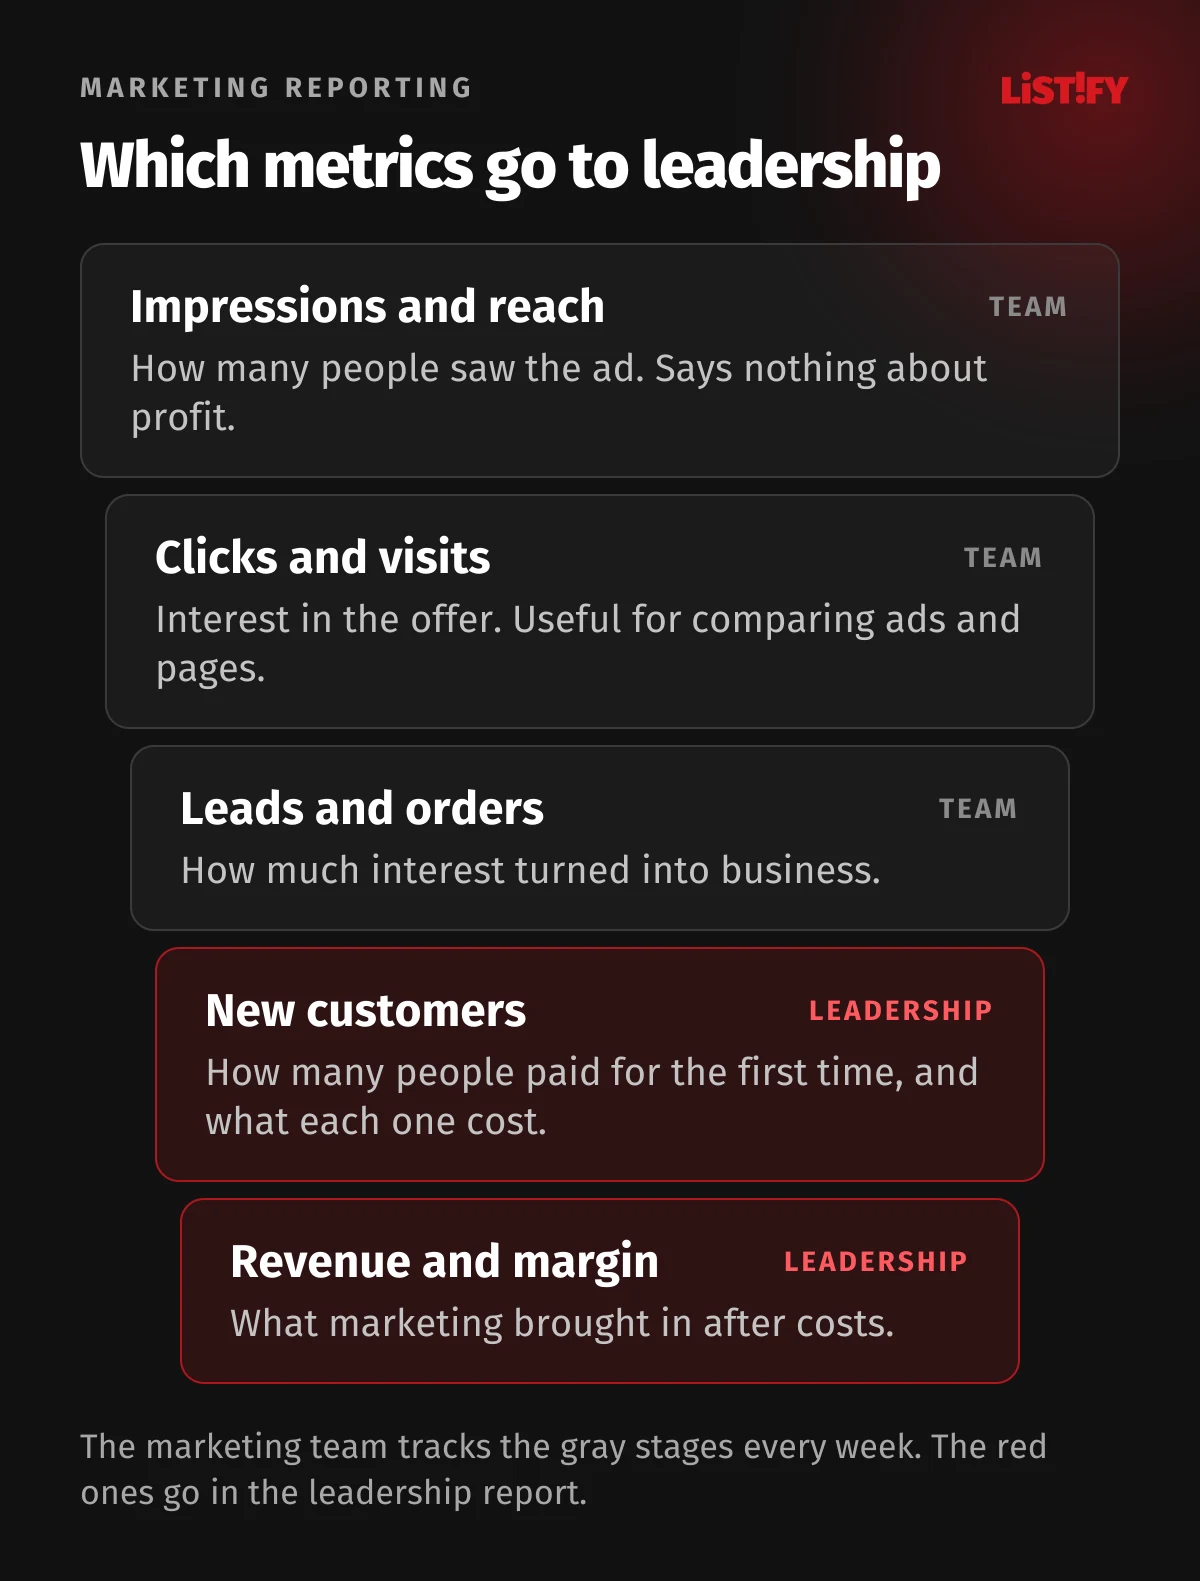
Business metrics are also linked to how leadership sees marketing. In its 2024 study, Gartner found that marketing leaders who used two or more types of “high complexity” metrics were up to 1.8 times more likely to prove value and get credit than those who used none. These include customer lifetime value (LTV), customer acquisition cost (CAC) and return metrics such as ROAS and ROI.
| Metric | How to calculate it | What to watch out for |
|---|---|---|
| ROAS (return on ad spend) | revenue from ads ÷ ad spend | Based on revenue, not profit. A ROAS of 5 can still mean a loss. |
| ACoS (advertising cost of sales) | ad spend ÷ revenue × 100 | The same as ROAS, seen from the other side. An ACoS of 20% equals a ROAS of 5. |
| CAC (customer acquisition cost) | all costs of winning customers ÷ number of new customers | Costs include the agency, tools and staff time. Count only first-time buyers. |
| ROMI (return on marketing investment) | (margin from sales driven by marketing minus marketing spend) ÷ marketing spend | Uses margin, not revenue. Strictly, only sales that would not have happened without marketing. |
| LTV (customer lifetime value) | margin a customer brings in over a chosen period | Calculate it from margin and pick a period leadership trusts, such as two years. |
| MER (marketing efficiency ratio) | total revenue ÷ total marketing spend | Doesn’t split by channel, but it isn’t skewed by differences between tracking tools. |
The often-quoted LTV to CAC ratio of at least 3:1 comes from the world of subscription software. Investor David Skok cites it in his SaaS metrics guide and adds that these are only guidelines, and there are situations where it makes sense to break them. For an online store or a manufacturer, don’t treat it as a rule.
04Worked example: a ROAS of 3.6 that loses money on the first order
The easiest way to see why the choice of metric matters is with numbers. Take an online store that spent $15,000 on ads in September, plus another $4,500 on an agency and tools. The figures are made up, but the math works the same for any business.
| Item | Value | Calculation |
|---|---|---|
| Ad spend | $15,000 | input |
| Agency and tools | $4,500 | input |
| Total marketing spend | $19,500 | 15,000 + 4,500 |
| New customers | 90 | input, first purchase only |
| Revenue from first orders | $54,000 | 90 × $600 net of tax |
| ROAS | 3.6 (360%) | 54,000 ÷ 15,000 |
| Margin on first orders | $18,900 | 35% of revenue |
| Customer acquisition cost (CAC) | $216.67 | 19,500 ÷ 90 |
| Result on first orders | loss of $600 | 18,900 minus 19,500 |
| Margin over two years | $45,360 | 90 × $210 × 2.4 orders |
| ROMI over two years | 133% | (45,360 minus 19,500) ÷ 19,500 |
- Marketing spend$19,500
- Margin on first orders$18,900
- Margin over two years$45,360
Worked example from the table above, 35% margin, 2.4 orders per customer over two years.
A report that stops at a ROAS of 3.6 looks like a win. A report that stops at the first order looks like a failure. What actually decides the outcome is how often customers come back. If your store or CRM data shows that the average customer orders 2.4 times over two years, the campaign pays off. If you don’t know, find out first. And tell leadership plainly: the return depends on the repeat purchase assumption, and we will run the first check in six months.
Watch out for tax, too. Depending on how tracking is set up, the order values sent to ad platforms can include VAT or sales tax (and sometimes shipping), while your accounts show net revenue. If a report mixes the two, leadership sees revenue that is higher than what the CFO will report. At a 20% VAT rate, revenue looks 20% higher than it really is.
One last caveat concerns the revenue itself. By definition, ROMI counts only sales that would not have happened without marketing. Some of those 90 customers would have come anyway, for example by searching for the company name. The figure from ad platforms is therefore closer to an upper bound than an exact value.
If you are still deciding how much to put into marketing in the first place, our guide on how much to spend on online marketing walks through the calculation.
05A number without a comparison means nothing
“90 new customers” means nothing on its own. Leadership needs to know whether that is more or less than expected. Every metric therefore needs two comparisons: against the plan and against the same period last year. If your business is seasonal, a month-over-month comparison will mislead more than it helps. December against November always looks great for a gift shop.
For charts, it pays to borrow the rules UK government analysts follow in their data visualization guidance:
- The chart title states the message. Not “Leads 2026” but “Leads from search fell by a fifth.”
- Bar charts start at zero. A broken axis exaggerates differences, and leadership ends up debating a two percent change as if it were half.
- Pie charts only as an exception. Five slices at most, adding up to a meaningful whole, with one clearly dominant. Otherwise, use bars.
- No 3D, shadows or decoration. They add no information and make the chart harder to read.
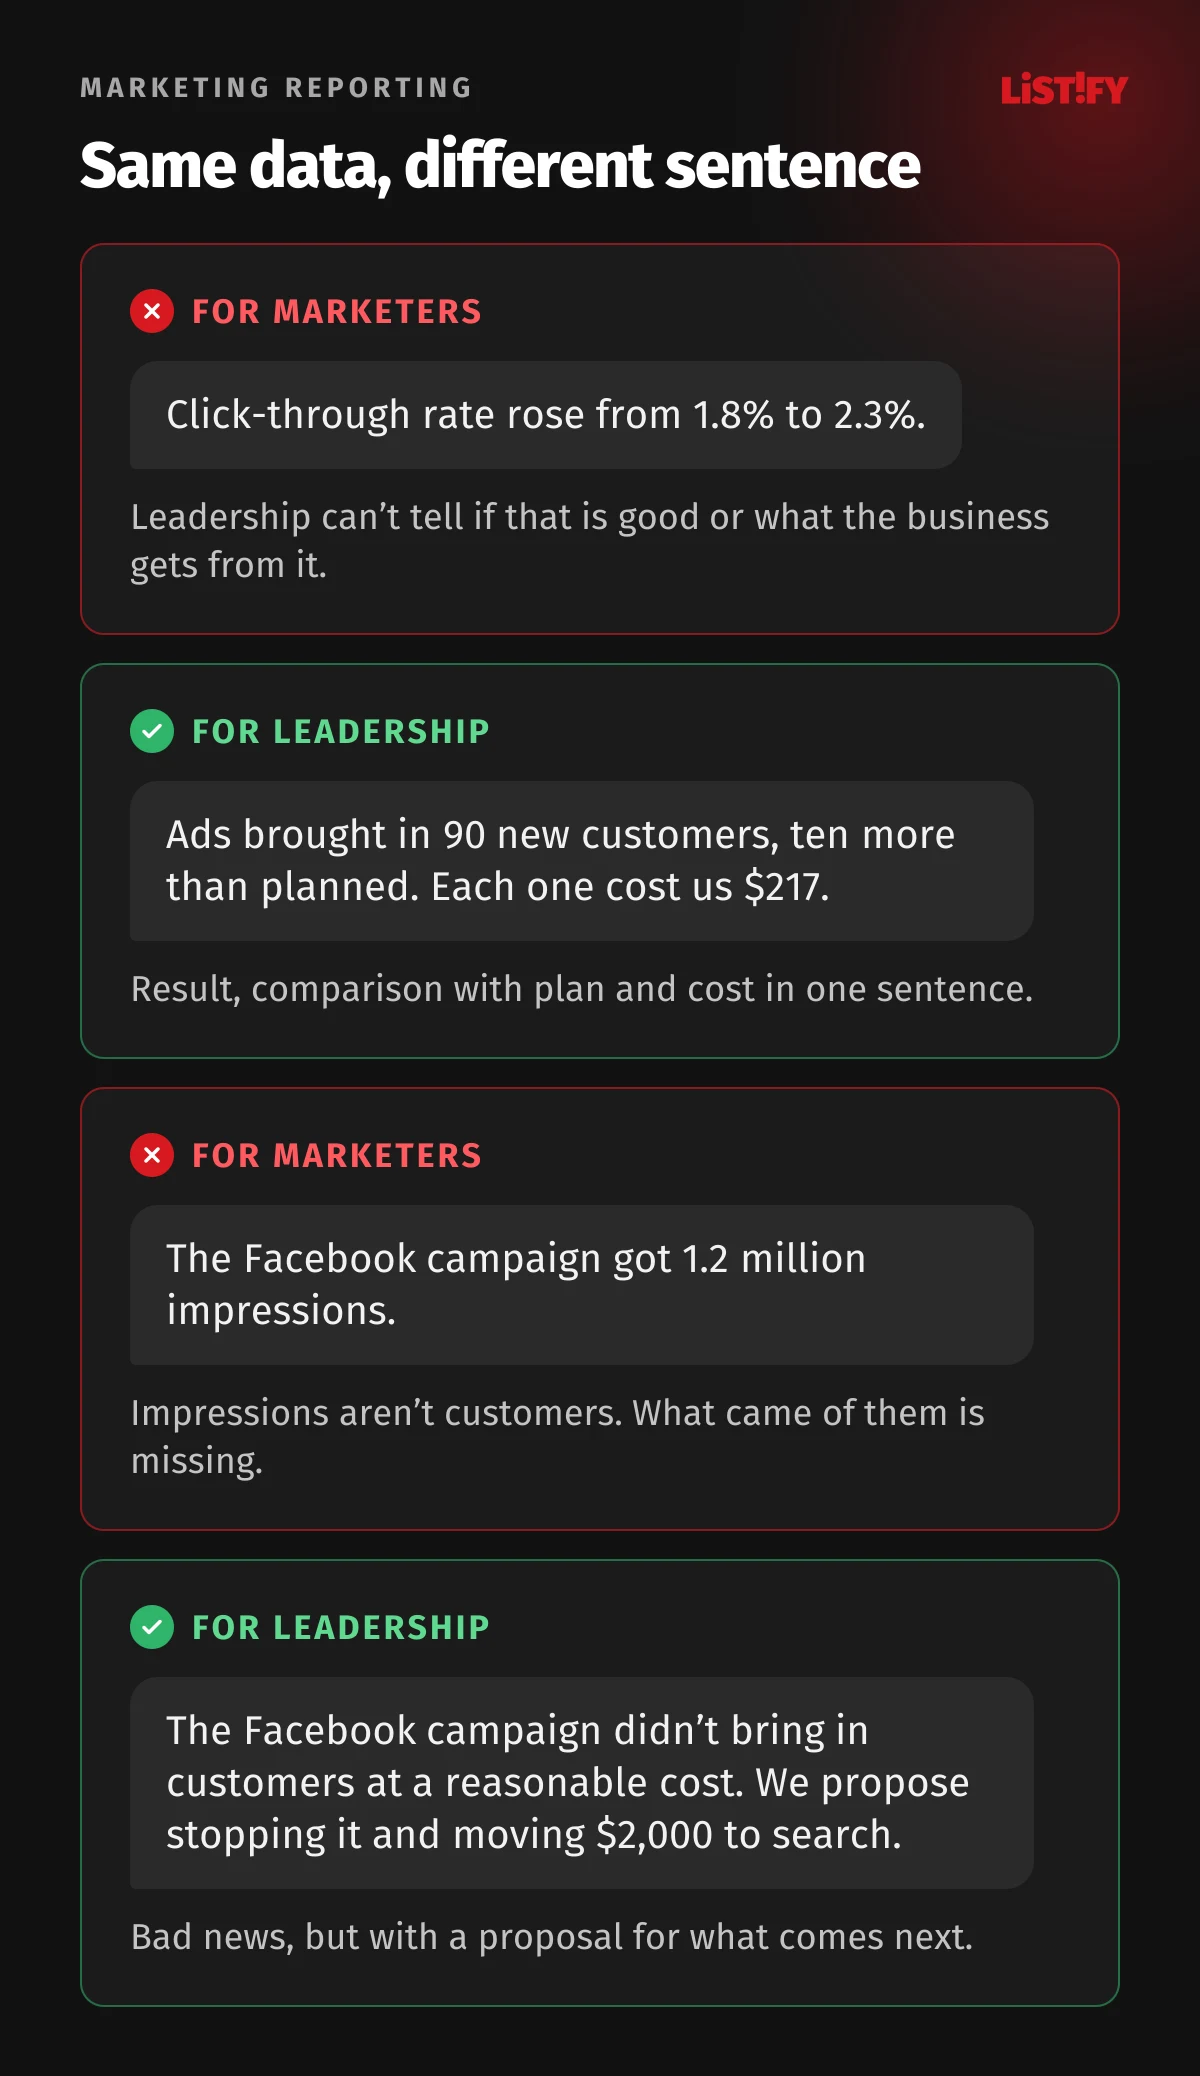
Sentences matter as much as charts. Compare the same data written for a marketer and for leadership:
06The data exists, but it isn’t linked to revenue
According to Eurostat, 39.85% of EU businesses with ten or more employees analyzed data in 2025. Fewer have a system that connects marketing to customers and revenue: only 28.51% used customer relationship management (CRM) software, and 16.28% used business intelligence tools, per Eurostat.
- Analyze data39.9%
- Pay to advertise online (2024)32.6%
- Use CRM software28.5%
- Analyze customer data17.6%
- Use business intelligence software16.3%
EU27, businesses with 10 or more employees, 2025 (advertising 2024). Source: Eurostat, data analytics and business software including CRM and BI and advertising, data updated February 27, 2026.
The result is familiar: marketing sees clicks, sales sees orders, and nobody connects the two. That is where most leadership reports stall, stuck on ad platform numbers because nobody tracks revenue by customer source. We cover when spreadsheets stop being enough in Outgrown Excel? 9 Signs Your Business Needs a Custom CRM.
Linking the two doesn’t take a big project. Each order or lead just needs to keep its source (from UTM parameters in the link, for example), and once a month you match it against revenue and margin from your accounts.
07What can’t be measured, and how to tell leadership
In the EU, analytics and advertising cookies generally need prior consent. Google spells it out in its Ads Help: to keep using its tags for measurement, ad personalization and remarketing, you must collect consent from users in the European Economic Area and pass consent signals to Google. People who say no are either missing from analytics entirely or appear only as modeled estimates. According to Eurostat, 55.19% of EU residents aged 16 to 74 had refused to allow the use of their personal data for advertising in the previous three months (2025), and 36.48% changed browser settings to limit cookies. That isn’t the exact share of visits you lose, but it shows this is no rounding error.
The second problem is that every tool counts differently. Google Ads reports conversions against the date of the click, not the date of purchase, and says discrepancies against other analytics, often up to 20%, are expected. Since November 2023, Google Analytics 4 no longer offers first click, linear, time decay and position-based attribution. What remains is data-driven attribution and last-click variants. Meanwhile, Meta and Google can each claim the same order.
Google can fill in some of the missing data with modeling, but there are thresholds. Google Ads needs 700 ad clicks over seven days per domain and country for conversion modeling, and Google Analytics 4 needs, among other things, 1,000 events a day from users who declined consent for behavioral modeling. Smaller businesses often don’t meet these thresholds and work only with data from people who did consent.
What to do about it in the report:
- One source of truth for money. Take revenue and customer counts from your store, CRM or accounts. Ad platforms help split credit between channels. Don’t add up their numbers.
- Describe the uncertainty in one sentence. For example: “We can’t attribute about a third of orders to a campaign because the customer declined cookies.” Leadership copes far better with known uncertainty than with surprises.
- Same method every month. Even imperfect measurement shows a trend if it stays consistent. Announce any change in method and restate the comparison period.
- Test, don’t guess. Pause a campaign for a while in some regions or for some customers and compare the results with the rest. The difference shows how many sales the campaign really drove.
Companies with larger budgets can turn to marketing mix modeling (MMM). Since January 29, 2025, Google has offered its open-source Meridian model to all advertisers, and Meta develops the open-source Robyn package. Both need a longer data history and someone who knows how to work with statistical models.
08How often to report, and with what tools
Leadership doesn’t need a weekly campaign update. It needs a regular rhythm, so it knows what to expect and when:
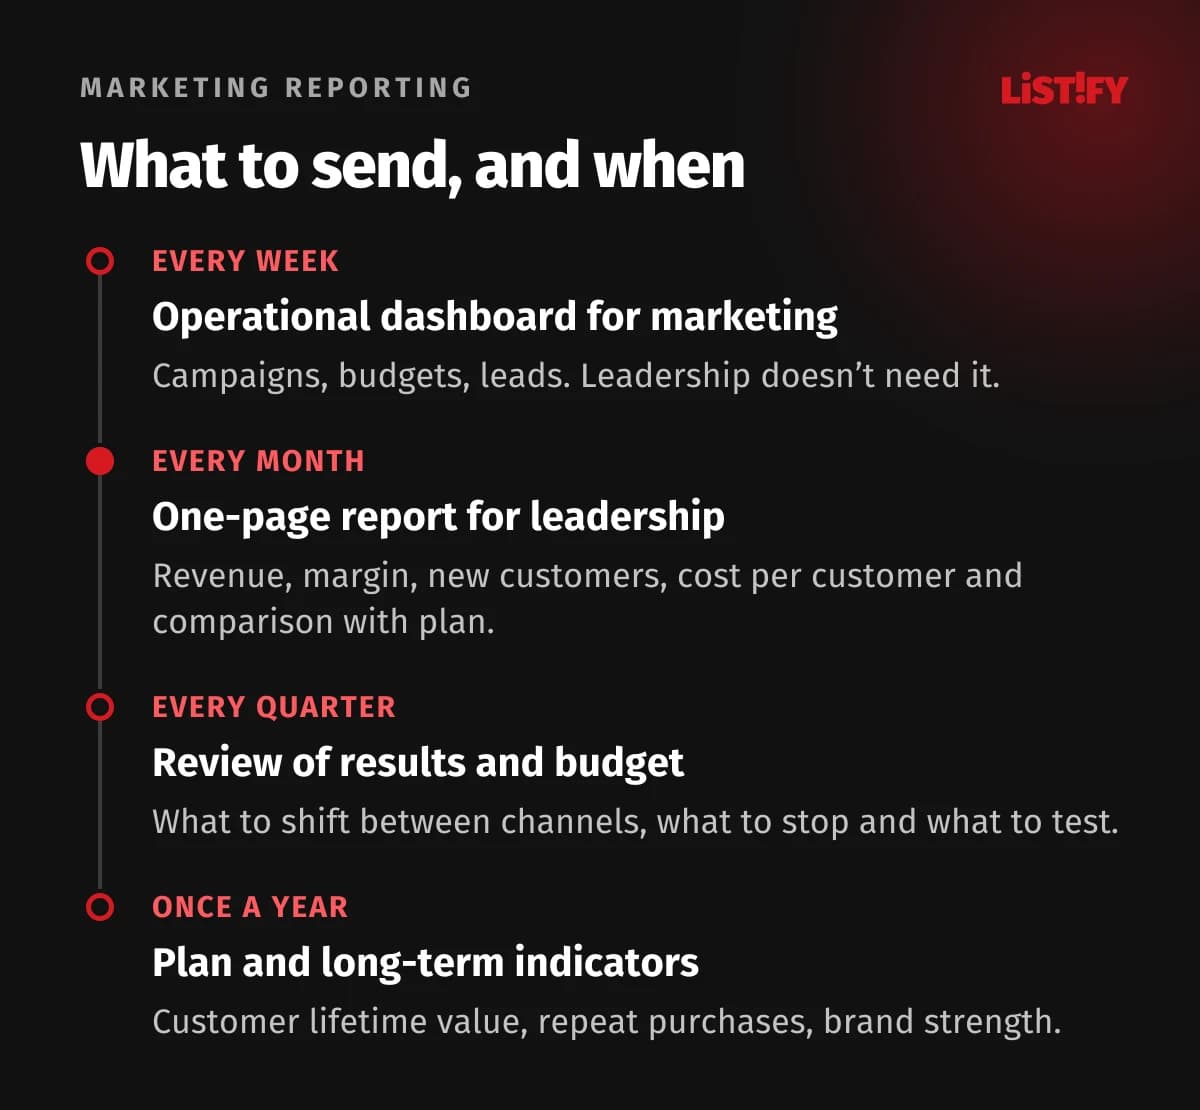
Brand and long-term effects don’t show up within a month, and a monthly report distorts them. According to The CMO Survey, only 41.8% of US companies can prove long-term impact with numbers. Show it quarterly and yearly instead, using branded search volume, direct visits or repeat purchase rate. For how to split the budget between brand building and performance campaigns, see Brand vs. Performance Marketing.
Free tools are enough for the dashboard itself. On April 16, 2026, Google rebranded Looker Studio back to its original name, Data Studio. The self-service version remains free, and Data Studio Pro costs $9 per user per project per month. Power BI or your CRM’s own reports work just as well. But a dashboard is no substitute for commentary. A chart shows that the numbers fell. Why they fell and what to do about it has to be written by a person.
Regular contact helps, too. According to Gartner, 62% of marketing leaders who meet regularly with their analytics leads can prove value and get credit, compared with just 30% of those who meet them infrequently. And The CMO Survey 2026 shows that the share of companies where marketing and finance work together on growth rose from 29.9% to 49.5% in three years. Before you send the first report, agree with finance on what counts as revenue, margin and a new customer.
09The most common mistakes in leadership reports
- Adding up conversions from several platforms. Google Ads, Meta and a marketplace can all claim the same order. The total ends up higher than the number of orders in your store.
- Revenue with tax in one line and without it in another. A gap like that is enough for the CFO to stop trusting the whole report.
- Quietly changing definitions. Once the meaning of “new customer” changes, the year-over-year comparison stops working.
- Twenty charts instead of five numbers. The more a report shows, the harder it is to find what matters.
- Good news only. A report that never admits something isn’t working will stop being taken seriously.
- Percentages without a base. 100% lead growth sounds great until it turns out to be two leads instead of one.
- Recycled statistics. The line “80% of CEOs don’t trust marketers” has been circulating online for years. The page it comes from gives no date and no methodology. A leadership report should only include numbers where you know who measured them and when.
10FAQ
How should you present marketing results to leadership, and how long should the report be?
One page or one screen: the main message, three to five metrics compared with plan and last year, an explanation, next steps and a question for a decision. Detailed campaign tables belong in an appendix or a dashboard.
What is the difference between ROAS and ROI?
ROAS divides ad revenue by ad spend. ROI works with profit, so it also subtracts the cost of goods. In the example from Google Ads Help, a business sells products for $1,200, production costs $600 and ads cost $200. ROI comes out at 50%, while ROAS for the same campaign is 600%.
Why don’t Google Analytics and ad platform numbers match?
Each tool attributes conversions differently. Google Analytics splits credit according to its attribution model, Google Ads counts conversions against the click date, and each ad platform only sees its own clicks. On top of that, data from people who decline cookies is missing. Google’s own help page says discrepancies, often up to 20%, are expected.
How do I include brand building that doesn’t pay off right away?
Keep it separate from monthly campaign results and report it quarterly. Useful measures include branded search volume, direct visits, repeat purchase rate or a brand awareness survey. Tell leadership up front when you expect to see results.
How often should I send reports to leadership?
A one-page report monthly and a review meeting on results and budget quarterly. Weekly campaign numbers belong to the marketing team. Leadership only needs them when results are far off plan.
Do we need an expensive reporting tool?
Usually not. Data Studio (formerly Looker Studio) has a free version, and a spreadsheet is enough for a one-page report. What matters more is that orders and leads carry their source and can be matched with revenue and margin from your accounts.
11Sources
- Gartner: only 52% of senior marketing leaders can prove marketing’s value (press release via Business Wire)
- The CMO Survey, Fall 2024 (PDF)
- The CMO Survey 2026 (PDF)
- Nielsen: Marketing ROI Blueprint 2025
- Chief Marketer: McKinsey CMO Growth Research Survey 2024
- Eurostat: data analytics in enterprises
- Eurostat: CRM and BI in enterprises
- Eurostat: privacy and protection of personal data
- Google Ads Help: EU user consent and consent mode
- Google Analytics Help: attribution models
- Google Ads Help: understanding conversion data
- Google Ads Help: conversion modeling requirements
- Google Analytics Help: behavioral modeling
- Google Ads Help: calculating ROI
- MASB: marketing return on investment
- David Skok: SaaS metrics 2.0
- Google: Meridian open to everyone
- Meta: Robyn
- Google Cloud: Data Studio release notes
- Google Cloud: Data Studio pricing
- Government Analysis Function: data visualisation, charts
- US Army: AR 25-50 Preparing and Managing Correspondence (PDF).pdf)
- Barbara Minto: The Pyramid Principle
- Fournaise Marketing Group
Figures as of September 30, 2026.