Brand vs. Performance Marketing: How to Split Your Budget So Your Ads Still Pay Off Next Year
Put almost your entire budget into ads that have to sell today and your Google Ads dashboard will look great, right up until growth stalls. Analysis by the UK's IPA shows campaigns are most effective on average when roughly 60% of the money goes into brand building and 40% into performance campaigns. A smaller business can't copy that rule word for word, though. Here is where the 60:40 split comes from, when to move away from it, and how to set and measure the balance without expensive research.
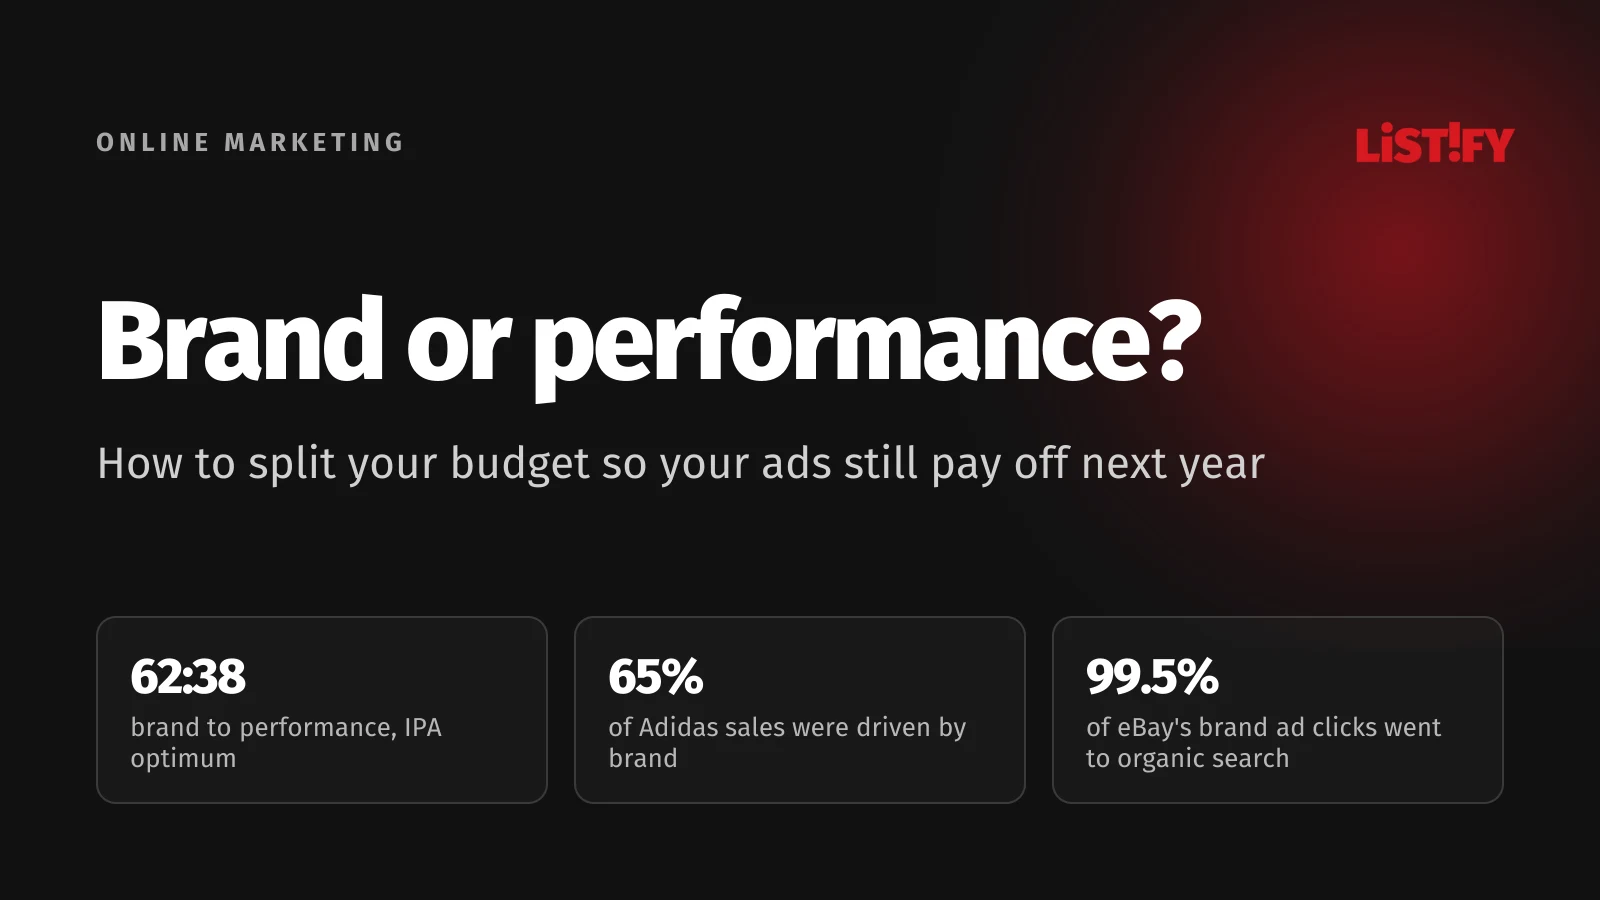
Short answer: a new business should put most of its money into performance campaigns that capture existing demand, such as search ads, shopping campaigns and retargeting. Once revenue is stable and extra search spend stops bringing in new customers, start shifting part of the budget into brand building, up to about 60% if you sell to consumers. For companies selling to other businesses, IPA data puts the optimum at 46% brand and 54% performance. Treat all of these numbers as reference points, not laws. What matters is your category, your stage and how often people in your market buy.
This guide is for owners, founders and marketing managers at small and mid-sized businesses. The figures are current as of September 2026, and each one links to its source.
01Brand building vs. performance marketing: what each one means
Performance marketing is advertising designed to trigger an action right away: a click, a lead or a purchase. You usually pay per click or per conversion, and results show up in Google Ads or Meta Ads Manager within days. Typical examples are search ads, shopping campaigns, retargeting and conversion campaigns on social media.
Brand building (brand marketing) has a different job. It makes sure people think of you when they need something, even a year from now. Video, TV, outdoor, sponsorship, podcasts and social content all fall into this bucket. The effect builds slowly, and you'll barely see it in your ad platform reports.
| At a glance | Brand building | Performance marketing |
|---|---|---|
| Goal | Get people to remember you when they're ready to buy | Get people who are buying now to buy from you |
| Who it reaches | Every potential customer, including people who aren't looking right now | People who are already searching or have shown interest |
| When it pays off | Months to years | Days to weeks |
| How it's measured | Brand awareness, branded search volume, direct traffic, market share | Clicks, conversions, cost per acquisition, return on ad spend (ROAS) |
| Typical channels | Video, TV, outdoor, sponsorship, content | Search, shopping campaigns, retargeting, conversion campaigns |
| Weak spot | Results are hard to prove quickly, so it's the first budget to get cut | Reports take credit for sales that would have happened anyway |
The two aren't rivals. Performance campaigns capture demand that already exists. Brand creates demand and raises the odds that people pick you. Researchers at the Ehrenberg-Bass Institute put it this way: people mostly buy from memory rather than by searching, and when they do search, they strongly prefer brands they already know (Ehrenberg-Bass Institute).
02The 60:40 rule: where it comes from and what it really says
The most quoted figures come from Les Binet and Peter Field. Working for the UK's Institute of Practitioners in Advertising (IPA), they analyzed campaigns from the IPA Databank, which collects entries to the IPA Effectiveness Awards. The ratio goes back to The Long and the Short of It (2013) and was updated in Effectiveness in Context (2018). Their finding: campaigns are most effective on average when about 60% of the budget goes to brand and 40% to sales activation. In the later study the optimum came out at 62:38, which the authors say is unlikely to be statistically different from 60:40 (Effectiveness in Context, IPA).
What the studies say about exceptions matters just as much. The optimum varies by category: 80:20 in favor of brand for financial services, 64:36 in retail, 60:40 for consumer packaged goods and 51:49 for other services. A brand-new brand does best with an almost reversed split in its first two years, 35:65 in favor of activation, moving toward 57:43 after the first year.
- Financial services80%
- Retail64%
- Consumer (B2C) average62%
- Consumer packaged goods60%
- New brand after the first year57%
- Other services51%
- Business to business (B2B)46%
- Not for profit44%
- New brand in its first two years35%
The rest, up to 100%, goes to performance (sales activation). Campaigns come from the UK's IPA Effectiveness Awards. Sources: Binet and Field, The 5 Principles of Growth in B2B Marketing (2019) and Effectiveness in Context (2018).
Selling to businesses: 46:54 and the 95:5 rule
Binet and Field ran a separate B2B analysis for the LinkedIn B2B Institute. The optimum came out at 46% brand and 54% activation. They also point out that the databank holds fewer than 50 B2B cases, so the ratio is a guiding principle rather than a precise prescription (LinkedIn B2B Institute).
John Dawes of the Ehrenberg-Bass Institute explains why B2B companies need a brand too. Businesses switch providers such as their main bank or law firm roughly once every five years on average. That means only about 20% of business buyers are in the market over a whole year, and something like 5% in any quarter. The other 95% aren't buying now, but they will be, and they'll remember the names they know. Dawes stresses that 95% is a heuristic, not a precise rule. If people in your category buy once every two years, around 13% of them are in the market in any given quarter (Ehrenberg-Bass Institute).
For how to turn this into actual campaigns, see our guide to generating B2B leads with paid ads and SEO.
03Why performance marketing overstates its own results
Performance campaigns have one big advantage: you can see the results in numbers. That's also the trap. An ad platform takes credit for every purchase that followed an ad click, even when the person would have bought anyway.
The best-known proof comes from eBay. In 2012 it switched off paid search ads on queries containing the eBay name on Yahoo! and MSN in the US, keeping them on Google for comparison. Of the clicks it gave up, 99.5% were immediately picked up by organic search results. People looking for eBay reached eBay regardless. A second experiment switched off non-brand keyword ads in part of the US. Calculated the usual way, the return on that spend came out above 1,400%. Compared with regions where the ads kept running, it was minus 63%. The ads did influence new and infrequent customers, but most of the money went on regular customers who would have bought anyway (Blake, Nosko and Tadelis, NBER).
Adidas is the second example. In 2019 its global media director, Simon Peel, admitted the company's advertising split was 23% brand and 77% performance. Four years earlier it had no econometrics or brand tracking and judged success on last-click attribution. Once it built an econometric model, the model showed that brand activity was driving 65% of sales across wholesale, retail and ecommerce (Marketing Week). Adidas's media team began pushing the 60:40 rule as a baseline across all its markets, though Peel said the extra brand spend wasn't necessarily the cause of its growth (Marketing Week).
- Brand's share of the ad budget23%
- Share of sales driven by brand65%
Wholesale, retail and ecommerce sales according to Adidas's econometric model. Source: Marketing Week, October 17, 2019.
Analytic Partners reaches a similar conclusion. According to its analysis, about 30% of paid search results are actually driven by brand and other upper-funnel advertising that reaches people before they start searching. As a result, last-click and other simple attribution models overstate the role of clickable channels by 2 to 10 times on average (Analytic Partners). Analytic Partners sells marketing measurement, so treat these as one company's numbers, even though they point the same way as independent research.
Privacy changes have made measurement harder still. Since iOS 14.5, apps on iPhone must ask for permission to track users (Apple). Meta estimated the hit to its 2022 revenue at around $10 billion and acknowledged that both ad targeting and measuring results had become harder for advertisers (Meta earnings call transcript). Platform reports now lean more on modeling and can miss or misattribute conversions in both directions, so treat them as estimates.
04What happens when you stop supporting your brand
According to Nielsen Compass data, a brand loses 2% of future revenue for every quarter it doesn't advertise. Nielsen adds that recovering can take three to five years of consistent brand building (Nielsen).
Airbnb went the other way. When the pandemic hit in 2020, it suspended substantially all performance marketing. Paid performance channels had brought in about 23% of its traffic in 2019, but only about 9% in the first nine months of 2020, when roughly 91% of traffic came directly or through unpaid channels (Airbnb S-1). The company then shifted its marketing mix toward brand. In Q4 2021, sales and marketing expense excluding stock-based compensation was 25% lower than in Q4 2019, mainly because of lower performance marketing spend (Airbnb shareholder letter).
- 20191,140
- 2020479
- 2021723
Brand and performance marketing combined, as reported in the annual report. In 2021 the mix moved toward brand. Source: Airbnb 10-K for 2021.
Airbnb doesn't prove that performance ads are pointless, though. It has an unusually strong brand, and according to a Skift analysis from August 2026 it is spending heavily on marketing again: in the first half of 2026 its brand and performance marketing spend rose 32% while revenue grew 17% (Skift).
One of the largest recent studies is The Multiplier Effect, published by WARC in January 2025 with Analytic Partners, BERA.ai, Prophet and System1, based on US data. According to Analytic Partners' modeling in the report, moving from performance-only advertising to a mix of brand and performance can improve total revenue ROI by 25% to 100%, with an average uplift of 90%. Moving the other way cut ROI by 40% on average. The study's partners sell marketing measurement themselves. The recommendation is to put at least 30% into brand, with 40% to 60% as a typical best-practice range, and to treat more than 25% of the budget going to search as a red flag (Bizcommunity on the WARC study, WARC).
05What 2026 budget data shows
Pressure for quick results hasn't gone away. In The CMO Survey from January 2026, pressure from CEOs, boards and CFOs had eased slightly from 2025 but was still felt by most marketing leaders, and 70.6% of those feeling it said they respond by focusing on short-term impact over long-run gains. Marketers have spent roughly 68% of their time managing the present and 32% preparing for the future every year since 2019 (The CMO Survey).
Gartner's CMO Spend Survey 2026, which covers 401 marketing leaders in North America, Europe and the UK, mostly at companies with over $1 billion in revenue, puts marketing budgets at 7.8% of company revenue. Digital channels now take 67.5% of marketing spend, up from 54.9% in 2023, and paid media hit a five-year high of 31.4% (Marketing Dive, Chief Marketer).
There are signs of a shift in the UK. The IPA Bellwether report for Q2 2026 found video budgets rising at their fastest pace in seven quarters, while other online spend, which the IPA sees as shorter-term activation, was cut for the first time in seven quarters (IPA Bellwether).
06How to find the right balance for a smaller business
The 60:40 split was built on campaigns from large brands entering an effectiveness competition. A business spending $2,000 a month can't simply adopt it. It makes more sense to start from your stage and your category.
| Situation | Where most of the money goes | Why |
|---|---|---|
| New business or new product | Performance campaigns, with a smaller share for brand (IPA: 35:65 optimum in the first two years) | You need your first customers and data on what works |
| Established business, search demand has stopped growing | Gradually add to brand, moving toward 50% to 60% | Performance campaigns have already captured most existing demand, brand has to create new demand |
| Selling to businesses with a long buying cycle | Roughly half and half (IPA: 46:54) | Only a small share of the market is buying, the rest need to remember you when their time comes |
| Trust-based categories (finance, health, legal) | More into brand (IPA for financial services: 80:20) | People buy from businesses they trust, and one ad won't change that |
| Small budget, local service | Search ads, with low-cost brand building: reviews, content, social media | Expensive brand formats may be out of reach, while local demand can be captured right away |
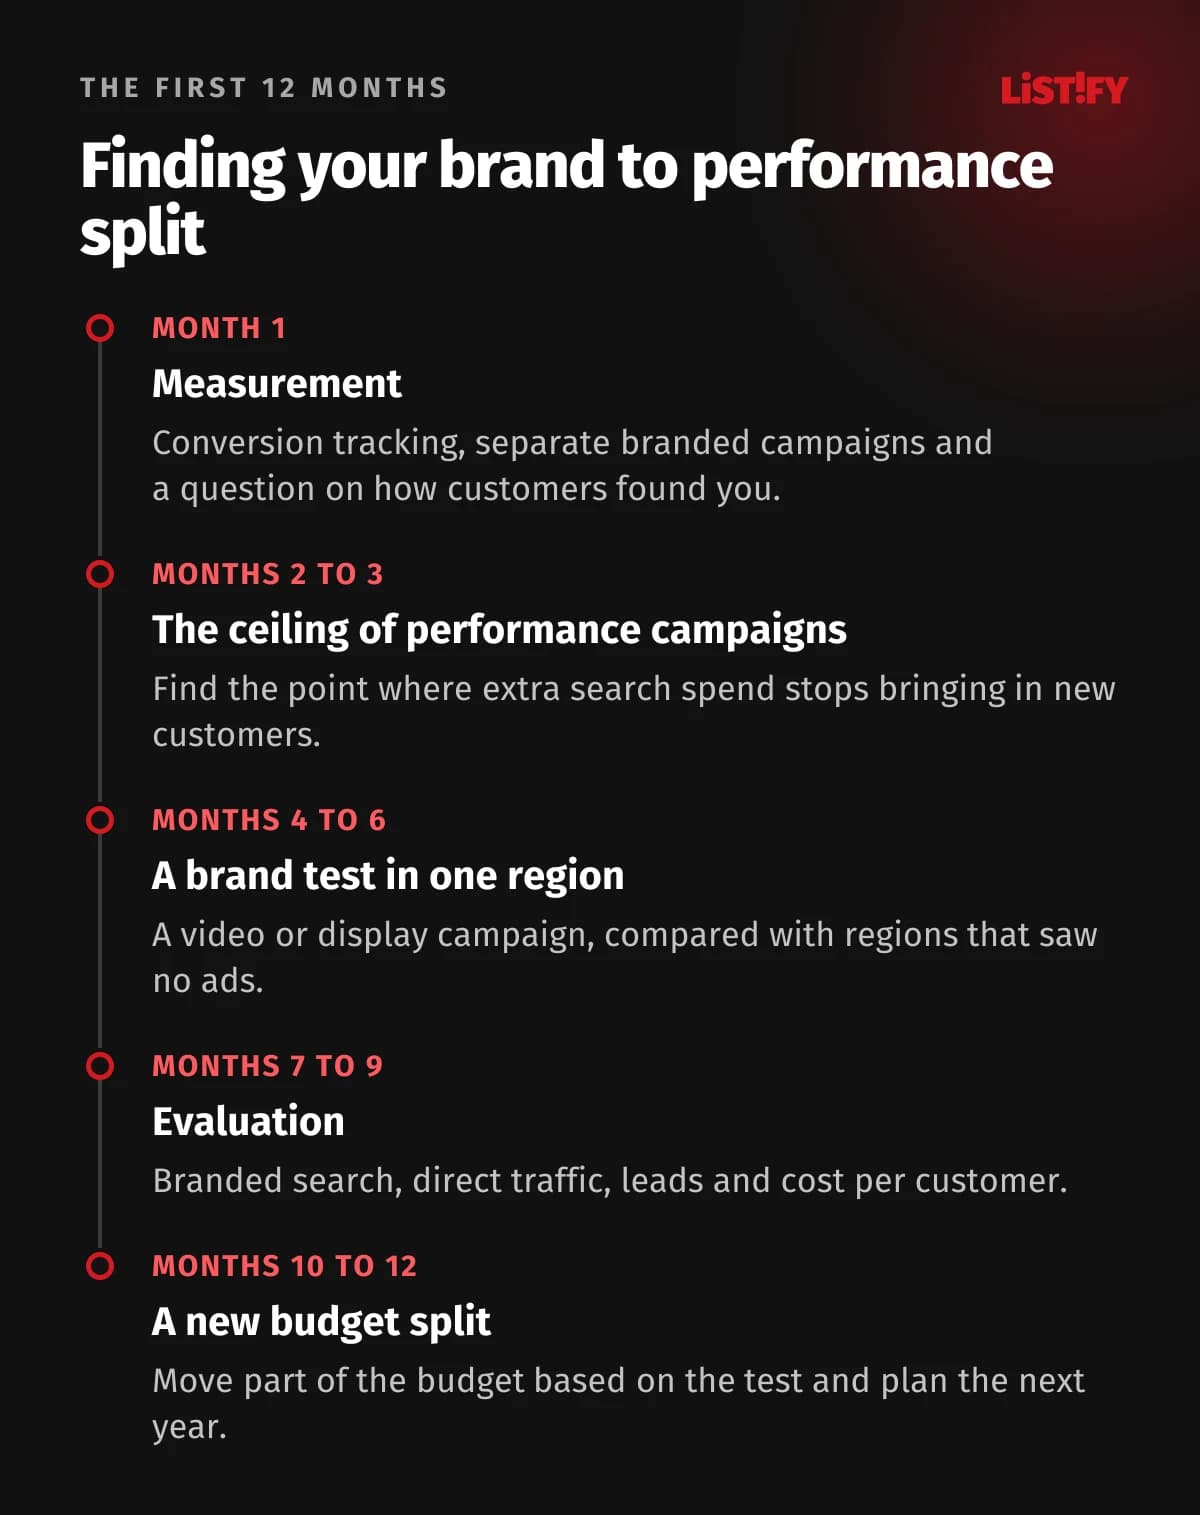
If you're still working out how much to spend on marketing overall, start with our guide on how much a small business should spend on marketing. This section is about splitting that budget. A process that works has five steps:
- Measure where customers come from. Set up conversion tracking in Google Ads and Google Analytics, and ask new customers how they heard about you.
- Separate your branded campaigns. Track ads on searches for your company name on their own. People searching for you already know you, so those sales owe more to your brand than to the ad.
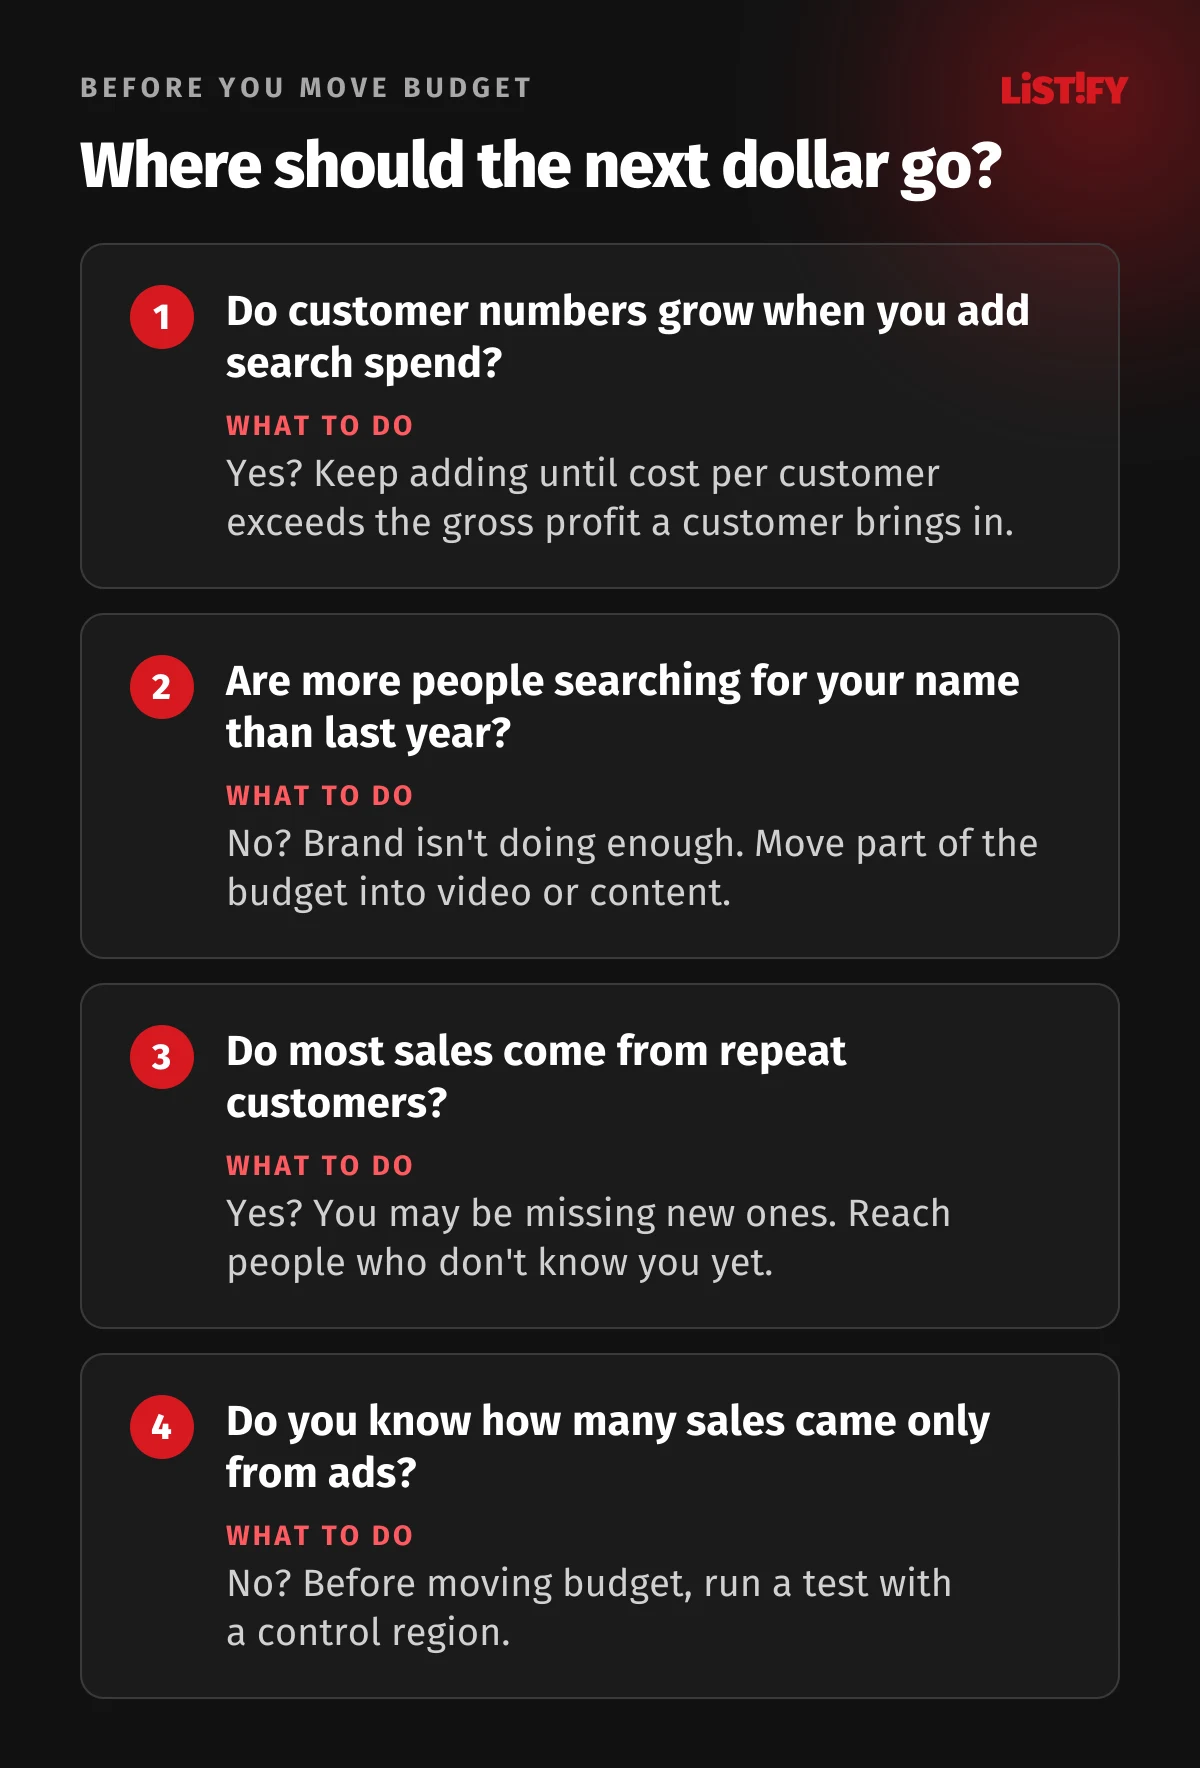
- Find the ceiling of your performance campaigns. When you add budget and customer numbers barely move while cost per acquisition climbs, you've captured most of the demand that's out there.
- Test brand in one region. Run a video or display campaign in part of your market only, then compare branded search and lead volume with regions that saw no ads.
- Change the split in small steps. Move something like a tenth of the budget per quarter and judge results over months, not weeks. According to Binet and Field, the long-term effects of advertising start to outweigh short-term effects after about six months.
07How to measure brand without expensive research
Google offers Brand Lift studies, which compare survey answers from people who saw your ads with answers from people who didn't. For video campaigns you need at least $5,000 to $15,000 over 10 days for a single survey question, depending on the country, with the US at $10,000, and access goes through a Google account representative (Google Ads Help). Smaller businesses can use cheaper signals:
- Share of search. How many people search for your name compared with your competitors. Les Binet and James Hankins introduced the metric in 2020, and an IPA think tank looking at 30 cases in 7 countries found that it represents about 83% of a brand's share of market on average. That's a correlation, not proof of cause (IPA). You can get the data for free from Google Trends.
- Branded search volume. Google Trends only shows relative numbers from 0 to 100 and displays zero for low-volume terms (Google Trends Help). For actual search volume, use Keyword Planner in Google Ads (Google Ads Help).
- Direct traffic and branded queries. Google Analytics and Search Console show how many people arrive directly or after searching for your name.
- Ask new customers. A “How did you hear about us?” question at checkout or on the first call costs nothing and often tells you more than an attribution model.
- Reach and frequency. For awareness campaigns, track how many people you reached and how often, not how many clicked.
Week-to-week swings tell you nothing. James Hankins, who presented the IPA think tank's findings, recommends a 6 to 12 month rolling average.
08The most common mistakes
- Judging brand by cost per conversion. A brand campaign will almost always lose in a Google Ads report. In the UK, Aldi's Swap & Save activation campaign from 2013 had a return on marketing investment of 472%, while its Like Brands brand campaign from 2011 had only 224%. But Like Brands was still lifting sales four months after it ended, and its effect grew over time (Effectiveness in Context).
- Cutting brand first when times are tough. The savings are instant, but according to Nielsen, winning back what you lose takes years.
- Paying for ads on your own name without testing. Sometimes they protect your top spot from competitors bidding on your name. Other times you're paying for clicks you'd get for free. Pause them for a few weeks and watch total search traffic, paid and organic combined.
- Judging a brand campaign after one month. The effect builds up gradually, and the first month won't show much.
- Treating 60:40 as law. It's an average of campaigns entered into a UK effectiveness competition. Your optimum depends on your category, size and stage.
- Building a brand nobody recognizes. An ad people can't attribute to you doesn't build your brand. Stick to the same logo, colors, tone and characters. For a logo that lasts, see Logo Design: 7 Rules for a Logo That Lasts for Years.
09FAQ
What is the difference between brand and performance marketing?
Performance marketing aims for a measurable action right away, such as a click, a lead or a sale, and is usually paid per click or conversion. Brand marketing aims to make people remember and trust you, so they choose you when they're ready to buy. Its effect builds over months and years rather than days.
What is the 60:40 rule in marketing?
It's the finding by Les Binet and Peter Field, based on the IPA Databank, that campaigns are most effective on average when about 60% of the budget goes to brand building and 40% to sales activation. Their 2018 study put the optimum at 62:38. The split varies by category, from 80:20 in financial services to 51:49 in other services, and B2B comes out at 46:54.
Does the 60:40 rule apply to small businesses?
Only as a rough guide. It's an average from large brands' campaigns in the UK. The same data shows an optimum of 35:65 in favor of performance for new brands in their first two years. A small business with a limited budget should start with performance campaigns and add brand spend once search ads stop bringing in new customers.
How can I increase brand awareness on a small budget?
Keep the same look and tone across every channel, publish useful content on your website and social media regularly, collect reviews, and try lower-cost formats such as YouTube video campaigns or display ads paid per impression. Track the results through branded search volume in Google Trends and Keyword Planner.
Should I bid on my own brand name?
It depends on whether competitors bid on it. If they do, brand ads protect your top position. If they don't, you're often paying for clicks that would have come through organic results. In eBay's study, organic results picked up 99.5% of the clicks after brand ads were switched off, but eBay is a household name that always ranks first for its own brand. A short test with the campaign paused is the best way to find out.
How long does brand building take to show results?
Early signals, such as more people searching for your name, can show up sooner. According to Binet and Field, though, the long-term effects of advertising only start to outweigh the short-term ones after about six months, and they keep building from there. Judge progress on a 6 to 12 month rolling average.
10The bottom line: capture demand first, then create it
Performance campaigns are the fastest route to your first customers, and a smaller business shouldn't start without them. But their reported results are usually inflated, and sooner or later they hit a ceiling, because they only capture demand that already exists. Once extra search spend stops bringing in new customers, it's time to invest in brand. Do it gradually and give each change several months before you judge it.
Ads alone don't build a brand. Content people actually want to see on social media does a lot of the work too. Our guide to a social media strategy that builds a real community covers how. At smaller companies, the founder is often part of the brand too. Our guide to personal branding for CEOs and founders explains how to build yours without cringe posts. If you'd like help splitting your budget, see how we manage online marketing and how working with us works.
11Sources
- IPA: Effectiveness in Context (Binet and Field, 2018), PDF
- LinkedIn B2B Institute: The 5 Principles of Growth in B2B Marketing (Binet and Field, 2019), PDF
- Ehrenberg-Bass Institute: the 95:5 rule (John Dawes, 2021)
- Blake, Nosko and Tadelis: Consumer Heterogeneity and Paid Search Effectiveness, NBER
- Marketing Week: Adidas and marketing effectiveness (2019)
- Analytic Partners: brand marketing and paid search
- Nielsen: long-term marketing and going dark
- Airbnb S-1 (2020), Q4 2021 shareholder letter and 10-K for 2021
- WARC: The Multiplier Effect (2025)
- The CMO Survey 2026: Highlights and Insights, PDF
- Marketing Dive: Gartner CMO Spend Survey 2026
- IPA Bellwether Report Q2 2026
- IPA: share of search
- Google Ads Help: set up Brand Lift
- Skift: Airbnb's marketing (2026)
- Meta Q4 2021 earnings call transcript, PDF