How to Measure Social Media Success When Likes Don’t Pay the Bills
A thousand likes feel great, but they won’t cover rent. If you want to know whether social media is paying off for your business, track the numbers that lead to money: clicks to your website, leads, orders and what each customer costs you. Below you’ll find which metrics matter, how to calculate engagement rate properly, why every tool shows a different number and how to connect social media to your website so you can see what it actually brings in.
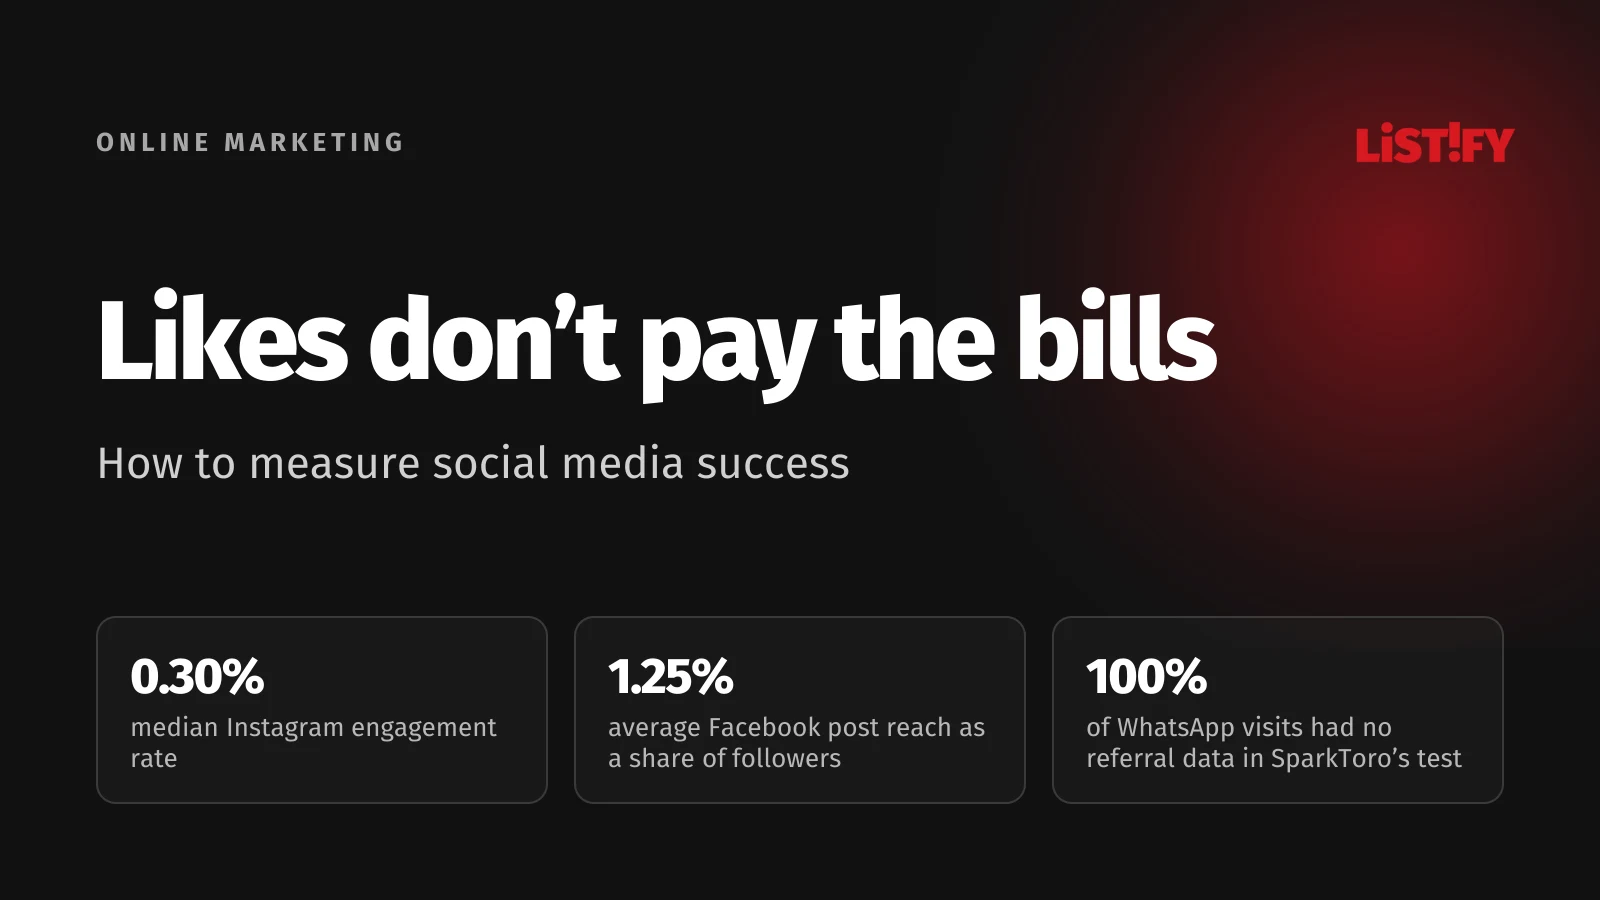
The short answer: the way to measure social media success is by what it brings the business, not by follower count. Pick one business goal (leads, orders, job applications), tag every link to your site with UTM parameters, set up key events in Google Analytics and once a month count how many leads came from social and what each one cost. Likes, reach and engagement rate then explain why the numbers move, but they don’t decide whether you’re winning.
01Why likes and followers aren’t enough
Follower counts and likes are classic vanity metrics. They look good in a slide deck but say nothing on their own about whether social media helps you sell more. They have three weaknesses.
- Followers aren’t your audience. In August 2026, the average reach of a brand’s Facebook post equaled just 1.25% of its follower count, and 3.20% on Instagram, according to Socialinsider’s analysis of 872,075 brand posts from January 2025 to August 2026 (Socialinsider). Ten thousand followers doesn’t mean ten thousand people will see you.
- A like is the cheapest reaction there is. It takes a second and says little about intent to buy. A comment with a question, a save or a share to a friend in a DM tells you far more.
- Raw numbers don’t compare. A thousand likes is a huge win for a brand with 2,000 followers and a drop in the bucket for one with 100,000. Quid, formerly Rival IQ, makes the same point in its annual benchmark study (Quid).
Meanwhile, social keeps growing. DataReportal counts 5.66 billion social media user identities worldwide, 68.7% of the global population, and online adults spend well over two and a half hours a day on social and video platforms (DataReportal). Budgets follow. In The CMO Survey 2026, US marketing leaders said they spend 14.25% of their marketing budget on social media and expect 17.06% within a year (The CMO Survey).
- Fall 202412.1%
- 202511.3%
- 202614.3%
- Expected in 12 months17.1%
- Expected in 5 years23.1%
Mean share reported by marketing leaders at US for-profit companies (2026: 308 respondents, January 2026). The survey’s own history shows 12-month forecasts for social spending have overshot actual spending by 2.1 points on average. Source: The CMO Survey.
More money means harder questions from whoever signs off on it. Sprout Social’s 2025 research among more than 1,200 marketing leaders found that most are confident social can drive revenue and new customers, even if their metrics don’t show it yet, but they aren’t sure their teams can tie social to those outcomes (Sprout Social). That gap is what this guide is about.
02The social media metrics funnel: from reach to revenue
Metrics make sense when you line them up. Attention sits at the top, money at the bottom. Each level explains the one below it: when leads drop, you look one level up to see whether people stopped clicking or never saw your posts in the first place.
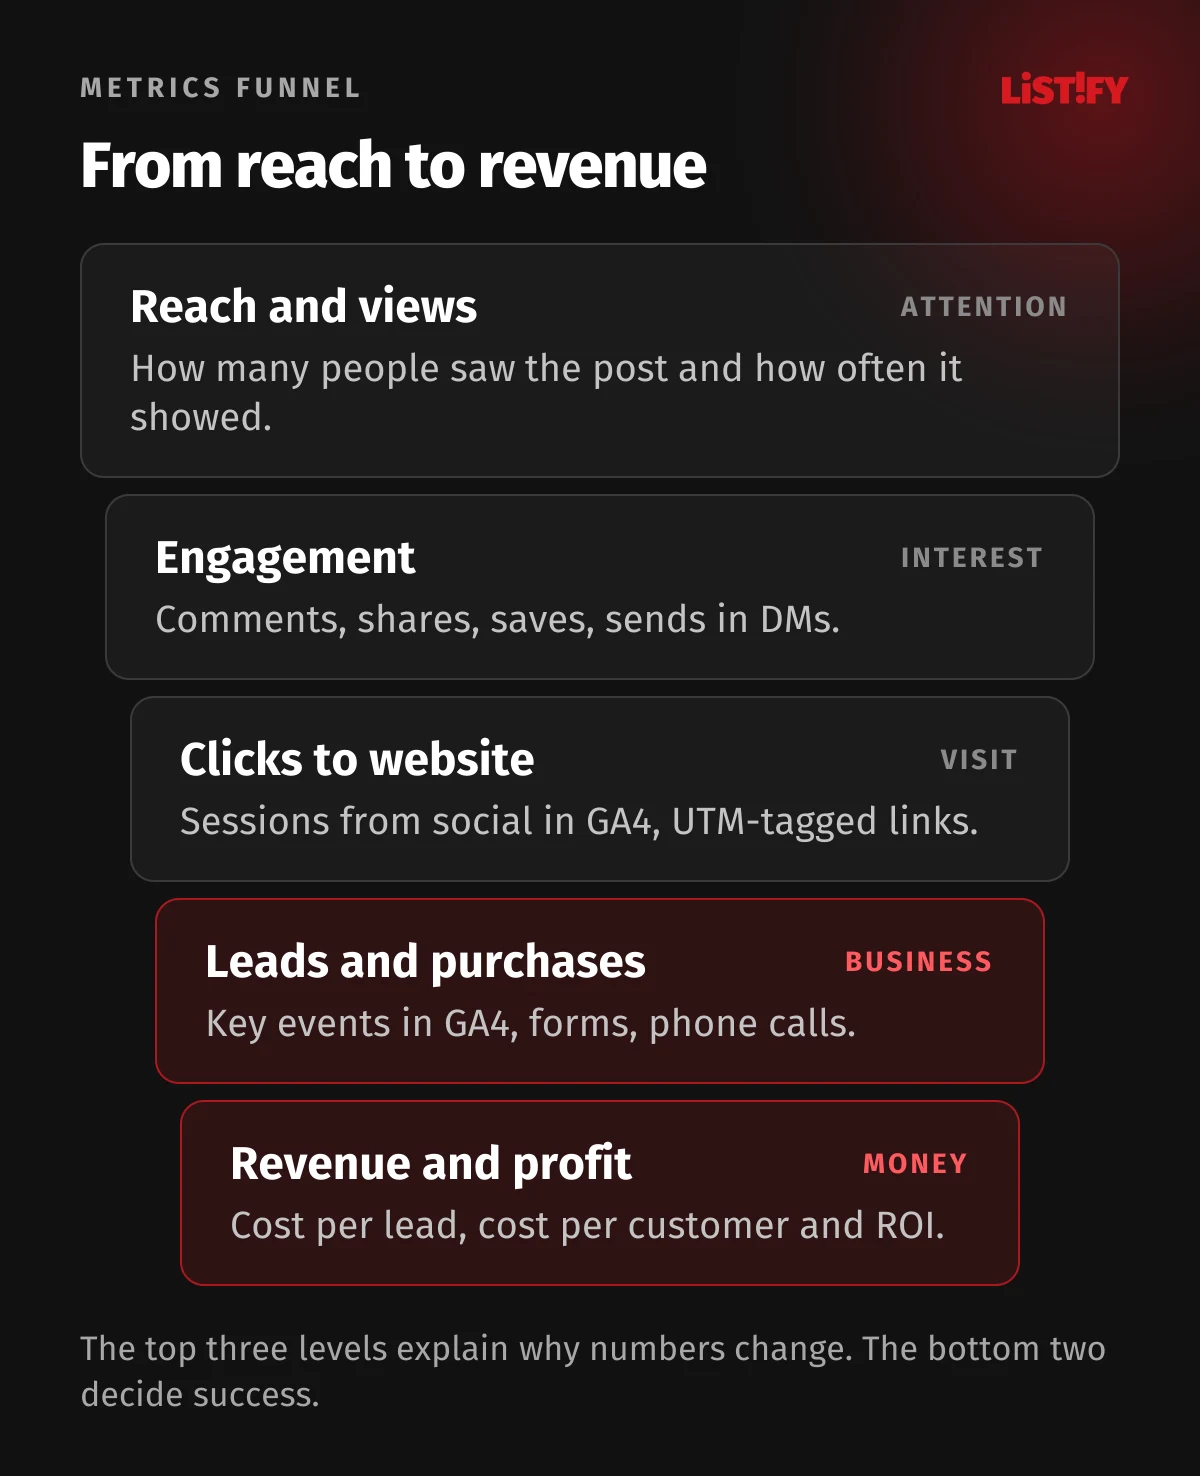
| Level | What to measure | Where to find it |
|---|---|---|
| Attention | Reach (how many people saw the post), views, video plays | Meta Business Suite, Instagram, TikTok and LinkedIn analytics |
| Interest | Comments, shares, saves, sends in DMs, engagement rate | Each network’s native analytics |
| Visit | Link clicks, sessions from social | Google Analytics 4, Organic Social and Paid Social channels |
| Business | Leads, orders, calls, sign-ups | Key events in GA4, CRM, online store |
| Money | Revenue, cost per lead and per customer, ROI | Accounting, CRM, your own calculation |
How much to put into social and ads in the first place is covered in our guide How Much to Spend on Online Marketing. This one is about telling whether that money and time are coming back.
03Engagement rate: the formula, and why every tool shows a different number
Engagement rate tells you what share of people reacted to a post. Engagements usually include likes, comments, shares and saves, sometimes clicks too. The catch is what you divide them by. There are three common formulas:
- By reach: engagements ÷ reach × 100. Shows how well the content landed with people who actually saw it. Hootsuite recommends it as the default for organic posts (Hootsuite).
- By followers: engagements ÷ followers × 100. You can calculate it for competitors from public data, which is why most benchmark studies use it. It naturally falls as an account grows.
- By impressions or views: engagements ÷ impressions × 100. Best suited to paid campaigns. It comes out lower than the rate by reach, because one person can see a post several times.
| Same post | Calculation | Engagement rate |
|---|---|---|
| By followers | 40 engagements ÷ 20,000 followers | 0.2% |
| By impressions | 40 engagements ÷ 1,300 impressions | 3.1% |
| By reach | 40 engagements ÷ 800 people who saw it | 5% |
Benchmark studies have the same problem. For Instagram, Quid reports a median of 0.30% (engagements divided by followers), Socialinsider an average of 0.48% (only likes and comments divided by followers) and Hootsuite an average of 3% without saying what it divides by. LinkedIn calculates engagement rate from impressions and counts clicks as interactions (LinkedIn Help). None of them is wrong; they just use different formulas. Before you compare your number with an industry average, find out how that average was calculated.
- TikTok2.01%
- Instagram0.30%
- YouTube0.21%
- Facebook0.04%
- X0.03%
Engagements divided by follower count, median of 150 randomly selected companies in each of 18 industries, organic and paid posts, 2025 data. Source: Quid, 2026 Social Media Industry Benchmark Report.
Quid’s data also shows engagement rates on Instagram and Facebook falling over time. Quid’s Instagram median dropped from 0.98% in 2020 to 0.30% in 2025. So if your engagement rate slips year over year, it may not be your fault. What matters more is whether your leads hold up.
04Organic reach: smaller accounts do better than they think
Organic reach is the number of people who see a post without paid promotion. Socialinsider measures it as a share of followers, and its data from January 2025 to August 2026 is clear: the smaller the account, the bigger the share of followers its posts reach. That’s good news for small businesses.
- 1K to 5K followersInstagram: 6.65%Facebook: 4.35%
- 5K to 10K followersInstagram: 5.75%Facebook: 3.40%
- 10K to 50K followersInstagram: 5.50%Facebook: 2.70%
- 50K to 100K followersInstagram: 4.50%Facebook: 1.50%
- 100K to 1M followersInstagram: 3.50%Facebook: 0.50%
Reach divided by followers, 872,075 posts from brand accounts (January 2025 to August 2026). Source: Socialinsider.
Format matters too. On Facebook, link posts have the lowest reach in the same analysis, 0.20% of followers on average, against 1.20% for images. According to Meta’s Widely Viewed Content Report, only 1.3% of US Facebook feed views in Q1 2026 went to posts linking outside Facebook. Since December 2025, Meta has also been testing a limit of two link posts a month for some pages without a Meta One subscription (Social Media Today). How widely the test applies outside the US isn’t clear yet.
That creates an awkward paradox for measurement: link posts get the worst reach, yet they’re the only ones where you reliably see a click to your site. It doesn’t mean you should drop links. Use them where readers have a reason to click (an offer, pricing, a sign-up) and let the rest of your content build awareness. How to build a community that actually talks back is covered in A Social Media Strategy That Builds Community.
05Platforms keep changing the metrics: Views replace impressions
If you compare numbers with last year, know that Meta has changed what it counts. In August 2024 Instagram made Views the primary metric across all formats and started counting repeat views. Facebook followed on November 14, 2024: for photos, text posts and Stories, Views replaced impressions and count how many times a post appeared on screen, including repeats (Meta for Creators). Reach, reactions, comments and shares stayed the same.
In the Graph API, Meta deprecated the Instagram impressions and plays metrics in favor of views, with requests for media created since July 2, 2024 failing from April 21, 2025 (Meta for Developers). Two practical consequences:
- Don’t compare last year’s impressions with this year’s views. Socialinsider itself notes that the 29% jump in Instagram views in 2025 may be partly down to the new way views are measured (Socialinsider).
- Use reach for year-over-year comparisons. It counts people, not displays, and for Facebook Meta explicitly said it would stay unchanged. If a third-party tool builds your reports, check that it pulls the right fields after the API change.
On LinkedIn, an impression counts when at least half the post is on screen for 300 milliseconds or when it’s clicked, and a video view counts after two seconds (LinkedIn Help). Every platform defines a view differently, so compare each network with itself.
06Connecting social to your website: UTM parameters and Google Analytics 4
To see how many visits and leads came from social, your analytics has to know where each visitor came from. That’s what UTM parameters do: short tags added to the end of a link. Google says to always use three: utm_source (where, e.g. facebook), utm_medium (the channel, e.g. social or paid_social) and utm_campaign (the campaign name) (Google Analytics Help).
https://www.yourcompany.com/offer?utm_source=instagram&utm_medium=social&utm_campaign=fall-sale
https://www.yourcompany.com/offer?utm_source=facebook&utm_medium=paid_social&utm_campaign=fall-sale- Use lowercase. Google Analytics treats Facebook and facebook as two different values, and your data splits.
- One fixed source name per network. Don’t mix fb, facebook and facebook.com. Google recommends a single unique utm_source for each platform.
- Tag paid campaigns with a paid medium. GA4 puts a visit in the Paid Social channel when it recognizes the source as a social site and the medium matches a paid pattern such as paid_social or cpc (Google Analytics Help). Links tagged with a social medium, and untagged clicks GA4 recognizes as coming from a social site, land in Organic Social.
- Keep every tagged link in one spreadsheet. If people build links by hand a different way each time, your data will be a mess within six months.
Key events: define what counts as success
In Google Analytics 4, important actions on your site are now called key events (formerly conversions). That might be a submitted form, a tap on your phone number, an order or a downloaded price list. Standard properties allow up to 30, and marking an event as key only applies from that moment on; historical data doesn’t change (Google Analytics Help). Set them up before you launch a campaign.
Attribution: why social often looks weak in reports
Someone sees you on Instagram, finds you on Google a week later and places an order. The attribution model decides who gets the credit. GA4 now offers only three: data-driven (the default), paid and organic last click, and Google paid channels last click. Google retired first click, linear, time decay and position-based models in 2023 (Google Analytics API announcement). Under last click, the network that brought the customer in first gets nothing. So don’t judge social on last click alone: keep the default data-driven model, which spreads credit across touchpoints, and ask customers how they found you (more on that below).
07What analytics can’t see: consent and dark social
Even with perfectly tagged links, some customers will be missing from your data. There are two reasons.
Visitors who decline cookies
In the EU and the wider European Economic Area, analytics and marketing cookies need the visitor’s consent first, and Google requires advertisers to collect consent from EEA users and pass consent signals to Google to keep using its measurement and remarketing features (Google Ads Help). Visitors who say no aren’t tracked with cookies.
Google can model some of the missing data in consent mode, but only for larger sites. Behavioral modeling in GA4 needs at least 1,000 users a day who consented and 1,000 events a day from those who didn’t, on at least 7 of the last 28 days (Google Analytics Help). A small business website usually won’t get there, so visitors without consent simply don’t appear. Assume the real number of visits and leads from social is higher than GA4 shows.
Sharing in private messages (dark social)
When someone sends a link to your site through WhatsApp or Messenger, analytics often can’t tell where the visit came from and files it under direct. In a 2023 SparkToro experiment, 100% of visits from TikTok and WhatsApp were marked as direct, and 75% of Messenger visits carried no referral information (SparkToro).
- TikTok100%
- WhatsApp100%
- Facebook Messenger75%
- Instagram DMs30%
- LinkedIn, public posts14%
- Pinterest12%
Small experiment: 1,000+ visits across 11 networks, about 100 participants mostly in the US and Canada, April 2023. It shows the direction, not the exact share for your site. Source: SparkToro.
The simplest fix costs nothing: ask. Add a “How did you hear about us?” field to your lead form, free text or a short list, and ask on the phone too. The answers aren’t precise, since people misremember where they first saw you. But they capture word of mouth, DM shares and podcasts that no analytics tool will ever see.
08Social media ROI: the formula and a worked example
The social media ROI formula is simple: take the profit social brought in, subtract the costs, divide the result by the costs and multiply by 100. Count every cost, not just ad spend: your team’s time or agency fees, photo shoots and tools belong in it too.
| Item | Example for one month | Note |
|---|---|---|
| Costs | $1,600 | $900 ads, $700 management and content |
| Leads from social | 11 | Key events in GA4 plus “How did you hear about us?” answers |
| Deals closed | 3 | From your CRM or sales team |
| Gross profit from deals | $3,400 | Margin, not revenue |
| Cost per lead | $145 | $1,600 ÷ 11 leads |
| ROI | 113% | $1,800 net return ($3,400 gross profit minus $1,600 costs) ÷ $1,600 |
Calculate from profit, not revenue. $6,800 in revenue looks better, but if you keep half of it, only $3,400 comes back to you. For long sales cycles or repeat purchases, measure over a longer period and factor in what a customer spends over the whole relationship.
With paid ads you can go further. Meta’s Conversion Lift test randomly splits people into a test group that sees your ads and a control group that doesn’t. The difference between the groups shows which results wouldn’t have happened without the ads (Meta). Standard Ads Manager reporting can’t separate those people from customers who would have bought anyway. Why performance ads tend to overstate their own impact is covered in Brand vs. Performance Marketing.
09What to put in a monthly report, and how often to look
A good report fits on one page and answers the question an owner would ask: is this paying off? Lead with business numbers, then add the ones that explain why.
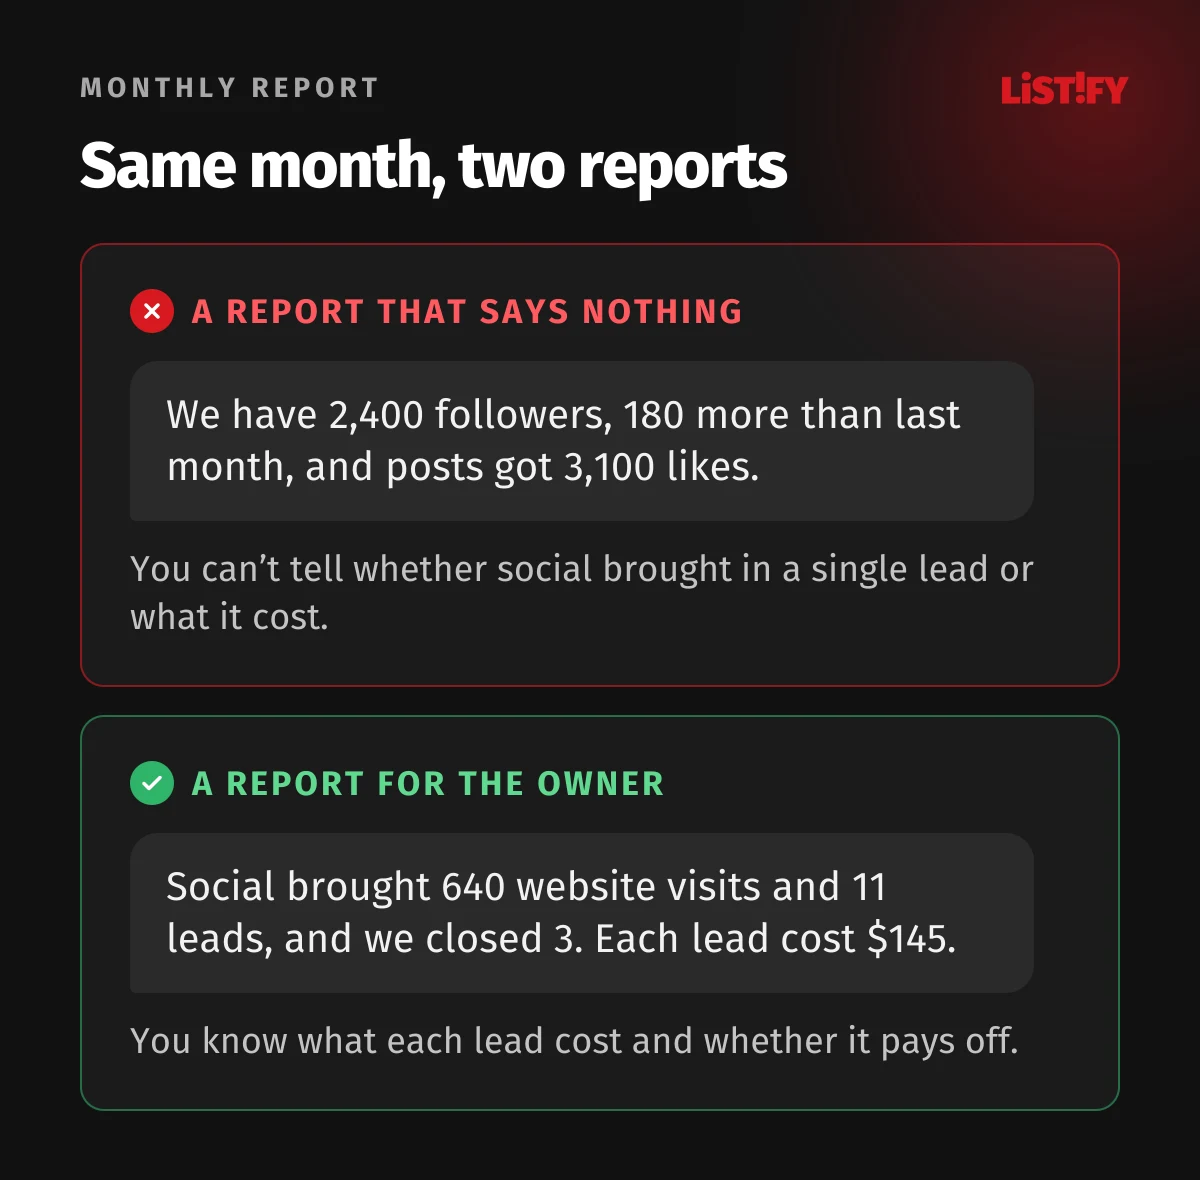
- Leads or orders from social and the change from last month.
- Cost per lead, and for paid ads, cost per customer.
- Website sessions from social by network (GA4, Organic Social and Paid Social channels).
- Reach and engagement rate by reach for your best and worst posts. Look for what they have in common.
- One decision for next month. A report without a conclusion is just a table.
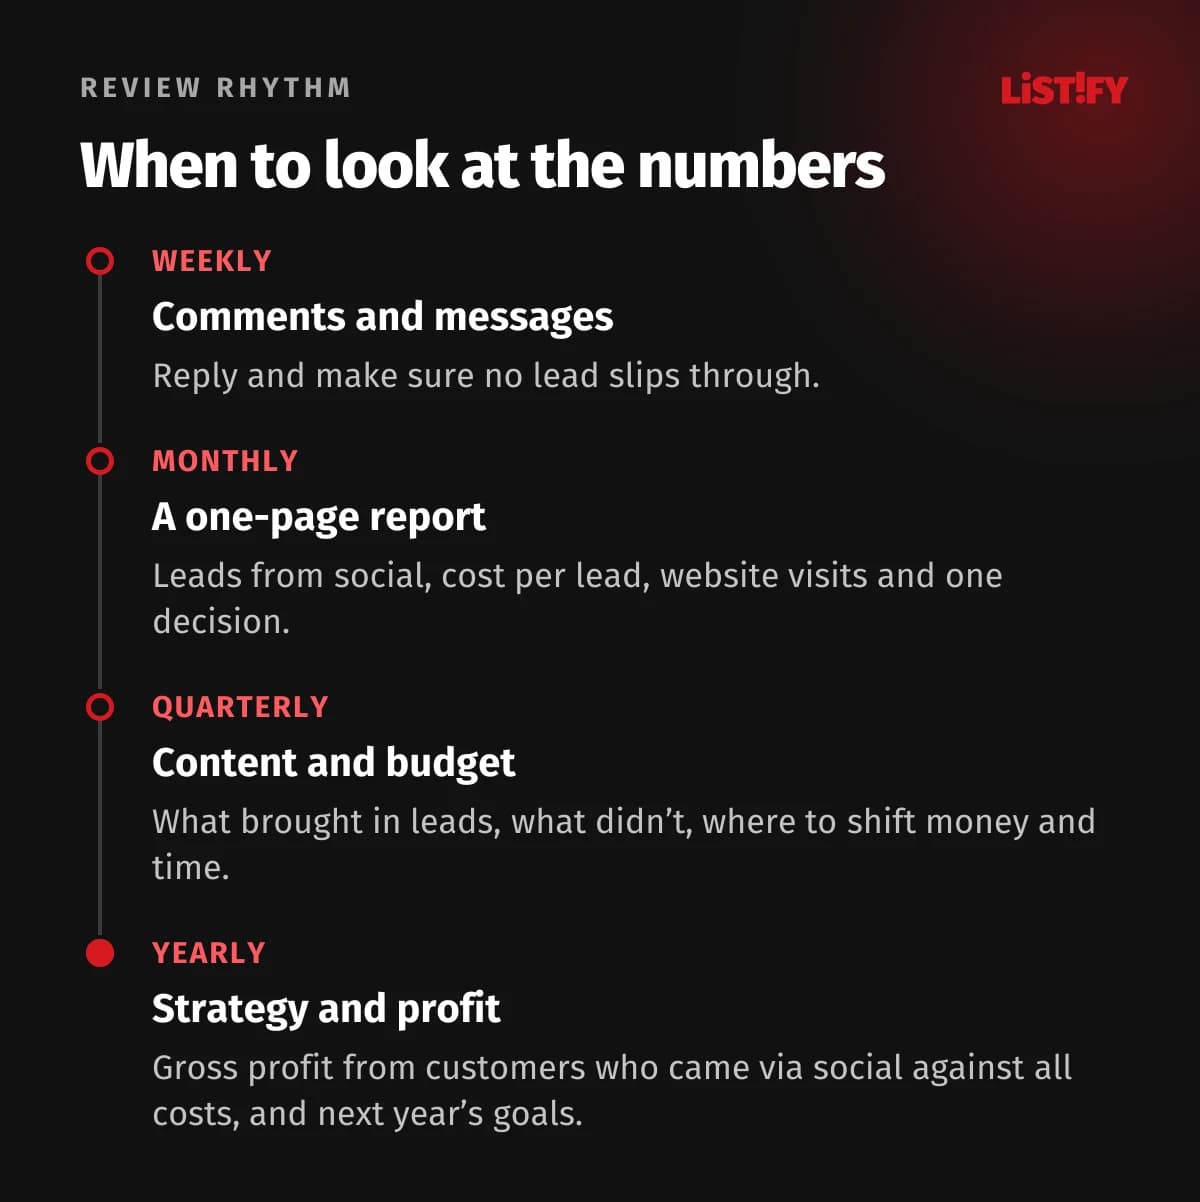
Checking likes daily mostly just makes people nervous. Organic posts need time, and single spikes mean little. People don’t live on social either: according to GWI data cited by DataReportal, online adults use social media on 4.21 days a week on average (DataReportal). One week won’t tell you whether it works.
10Common mistakes
- Bragging about followers. Followers can be bought or inflated with a giveaway. Leads can’t.
- Comparing engagement rates calculated differently. Your rate by reach and an industry average by followers can’t be compared.
- Links without UTM tags. Visits from Instagram, DMs and your bio link all blur into one channel or end up as direct.
- No key events. GA4 doesn’t know what success means for you, and it won’t backfill it later.
- Judging social on last click alone. Social often brings the customer in; search closes the sale.
- Comparing last year’s impressions with this year’s views. Meta changed the metric in between.
- Forgetting visitors who decline cookies. Real traffic is higher than analytics shows. Ask customers how they found you.
11FAQ
What is a good engagement rate on social media?
It depends on the network, your industry and above all the formula. Quid’s study (engagements divided by followers, 2025 data) puts the median at 2.01% on TikTok, 0.30% on Instagram, 0.21% on YouTube and 0.04% on Facebook. Hootsuite, which recommends calculating by reach, calls 1% to 5% a good engagement rate. The most reliable benchmark is your own past months, calculated the same way.
What is the engagement rate formula?
Engagement rate is the sum of engagements (likes, comments, shares, saves) divided by reach, followers or impressions, multiplied by 100. For organic posts, Hootsuite recommends calculating by reach: 40 engagements ÷ 800 people who saw the post × 100 = 5%. When comparing, always say what you divided by.
Which social media metrics should I track?
One or two from each level of the funnel: reach (attention), engagement rate by reach (interest), website sessions from social (visit), leads or orders (business) and cost per lead or ROI (money). The last two decide success; the rest explain why numbers change.
What are vanity metrics on social media?
Vanity metrics are numbers that look impressive but don’t show business impact on their own, typically follower counts, likes and raw impressions. They’re useful as context, but decisions should rest on leads, orders, cost per lead and ROI.
How do I calculate social media ROI?
Subtract all social media costs (ads, agency or staff time, content production, tools) from the gross profit generated by customers who came from social, then divide by the costs and multiply by 100. Example: $3,400 profit minus $1,600 costs = $1,800, divided by $1,600 = 113%.
Why don’t Meta Business Suite and Google Analytics numbers match?
They measure different things. Meta counts link clicks; GA4 counts sessions that actually loaded on your site and, in the EU, only for visitors who consented to cookies. Some people leave before the page loads, some decline cookies and visits from DMs often show up as direct. A sizable gap is normal, so watch the trend in each tool rather than expecting them to match.
12Bottom line: measure what pays the bills
Likes and followers tell you whether people find your content interesting. Whether social media pays off comes down to leads, orders and what each customer costs. Start with three steps: tag your links with UTM parameters, set up key events in GA4 and add a “How did you hear about us?” question to your forms. A month from now you’ll have your first numbers worth making decisions on.
If the owner is the face of the business on social, read Personal Branding for CEOs and Founders. Selling to other businesses? How to measure leads from ads and search is covered in B2B Lead Generation from Paid Ads and SEO. If you’d like us to set up your social media and measurement for you, see our social media management, pricing and how we work.
13Sources
- Quid (formerly Rival IQ): 2026 Social Media Industry Benchmark Report
- Socialinsider: social media reach on Facebook and Instagram (2026) and Social Media Benchmarks 2026
- Hootsuite: how to calculate engagement rate
- LinkedIn Help: Page post metrics
- Meta for Creators: introducing Views and Graph API v22.0 changelog
- Social Media Today: Facebook limits link posts (2026)
- Google Analytics Help: UTM parameters, key events, default channel group, behavioral modeling
- Google Analytics API: retirement of rule-based attribution models
- Google Ads Help: EU user consent policy and consent mode
- Meta: Conversion Lift
- SparkToro: dark social and direct traffic (2023)
- The CMO Survey 2026: Topline Report, PDF and Highlights and Insights, PDF
- Sprout Social: The Impact of Social Media Marketing (2025)
- DataReportal: Digital 2026 Global Overview Report