How to Calculate the ROI of Business Software (and Get Numbers That Still Hold a Year Later)
The vendor promises the system will pay for itself within a year. The spreadsheet in the proposal agrees. A year later, nobody can tell whether it did, because nobody measured how things worked before. You can calculate the return on a software investment honestly. You need four numbers, a measured baseline and the discipline not to count every hour saved as money saved. Using a fictional company, we show how big the gap can be: the same project comes out at 244% in the optimistic spreadsheet and at 29% once the assumptions are realistic.
Return on investment (ROI) tells you how much an investment earns on top of what you put in. For business software such as a CRM, an ERP, an internal portal or the automation of a single process, it is harder to calculate than for a machine or a solar installation. Software produces nothing by itself. It saves time, reduces errors, speeds up invoicing and gives you a clearer picture. All of that can be given a euro value, as long as you know how.
Plenty of companies are making exactly this decision. According to Eurostat, 46% of EU businesses with ten or more employees used ERP software in 2025 and 29% used a CRM, with large differences between countries:
- DenmarkERP: 66%CRM: 43%
- FinlandERP: 58%CRM: 56%
- Czech RepublicERP: 50%CRM: 36%
- EU averageERP: 46%CRM: 29%
- GermanyERP: 44%CRM: 30%
- PolandERP: 39%CRM: 24%
- SlovakiaERP: 27%CRM: 20%
Share of businesses with 10 or more employees, excluding the financial sector, agriculture and mining. Source: Eurostat, isoc_eb_iip, 2025 data.
Large companies have finance teams to model this. A 20-person business usually decides based on the vendor’s proposal and the owner’s gut. This guide is for that business.
01Four numbers you need to know
One number is not enough. ROI does not tell you when the money comes back, and the payback period does not tell you how much you will earn. Use them together:
| Metric | What it answers | How to calculate it | Watch out for |
|---|---|---|---|
| ROI (return on investment) | How much each euro invested earns | (benefits - costs) ÷ costs × 100% | It ignores time: 50% over three years looks the same as 50% over five. |
| Payback period | How long until the investment is recovered | Investment ÷ annual net benefit, or by adding up benefits year by year | It says nothing about what the project earns after payback. |
| NPV (net present value) | How far “in the black” the project really is today | Future benefits converted to today’s value with a discount rate, minus the investment | The result depends on the rate you choose. A positive NPV means the project earns more than your required return. |
| TCO (total cost of ownership) | What the software costs over its whole life | Purchase + running costs + maintenance + training + your own people’s time | Without TCO, every ROI figure is inflated because it counts only the quoted price. |
For a small or midsize business, the payback period and NPV are usually enough. The payback period answers “Can we afford to wait?” and NPV answers “Is it worth it?” ROI is useful for comparing two projects of the same length.
02Costs: count the full price over three to five years
The most common mistake is to plug only the quoted price into the formula. Gartner’s definition of TCO includes acquisition, management and support, end-user expenses, training, lost productivity and the cost of downtime. For business software, that means:
- Acquisition: development or licenses, analysis, design, configuration.
- Data migration: cleanup, import and checks, often underestimated (see migrating data from Excel or a legacy system).
- Integrations: accounting, online store, bank, warehouse.
- Your people’s time: meetings, testing, feedback, decisions.
- Training and ramp-up: the first few weeks are slower than before.
- Running costs: hosting, backups, monitoring, security updates.
- Per-user licenses: with off-the-shelf software, they grow with every new hire.
- Further development: processes change, and the system has to keep up.
Internal time counts as a cost just like the vendor’s invoice. If your sales director spends forty hours on the requirements, that costs the company money, even though nobody sends you a bill.
With subscription software, licenses make up most of the cost. With a custom system, the biggest expense comes at the start, followed by running costs and changes. We compared both over five years for three company sizes in How much a CRM really costs over 5 years.
03Benefits: where the money actually comes from
Business software benefits usually come from six sources. Each one is measured differently:
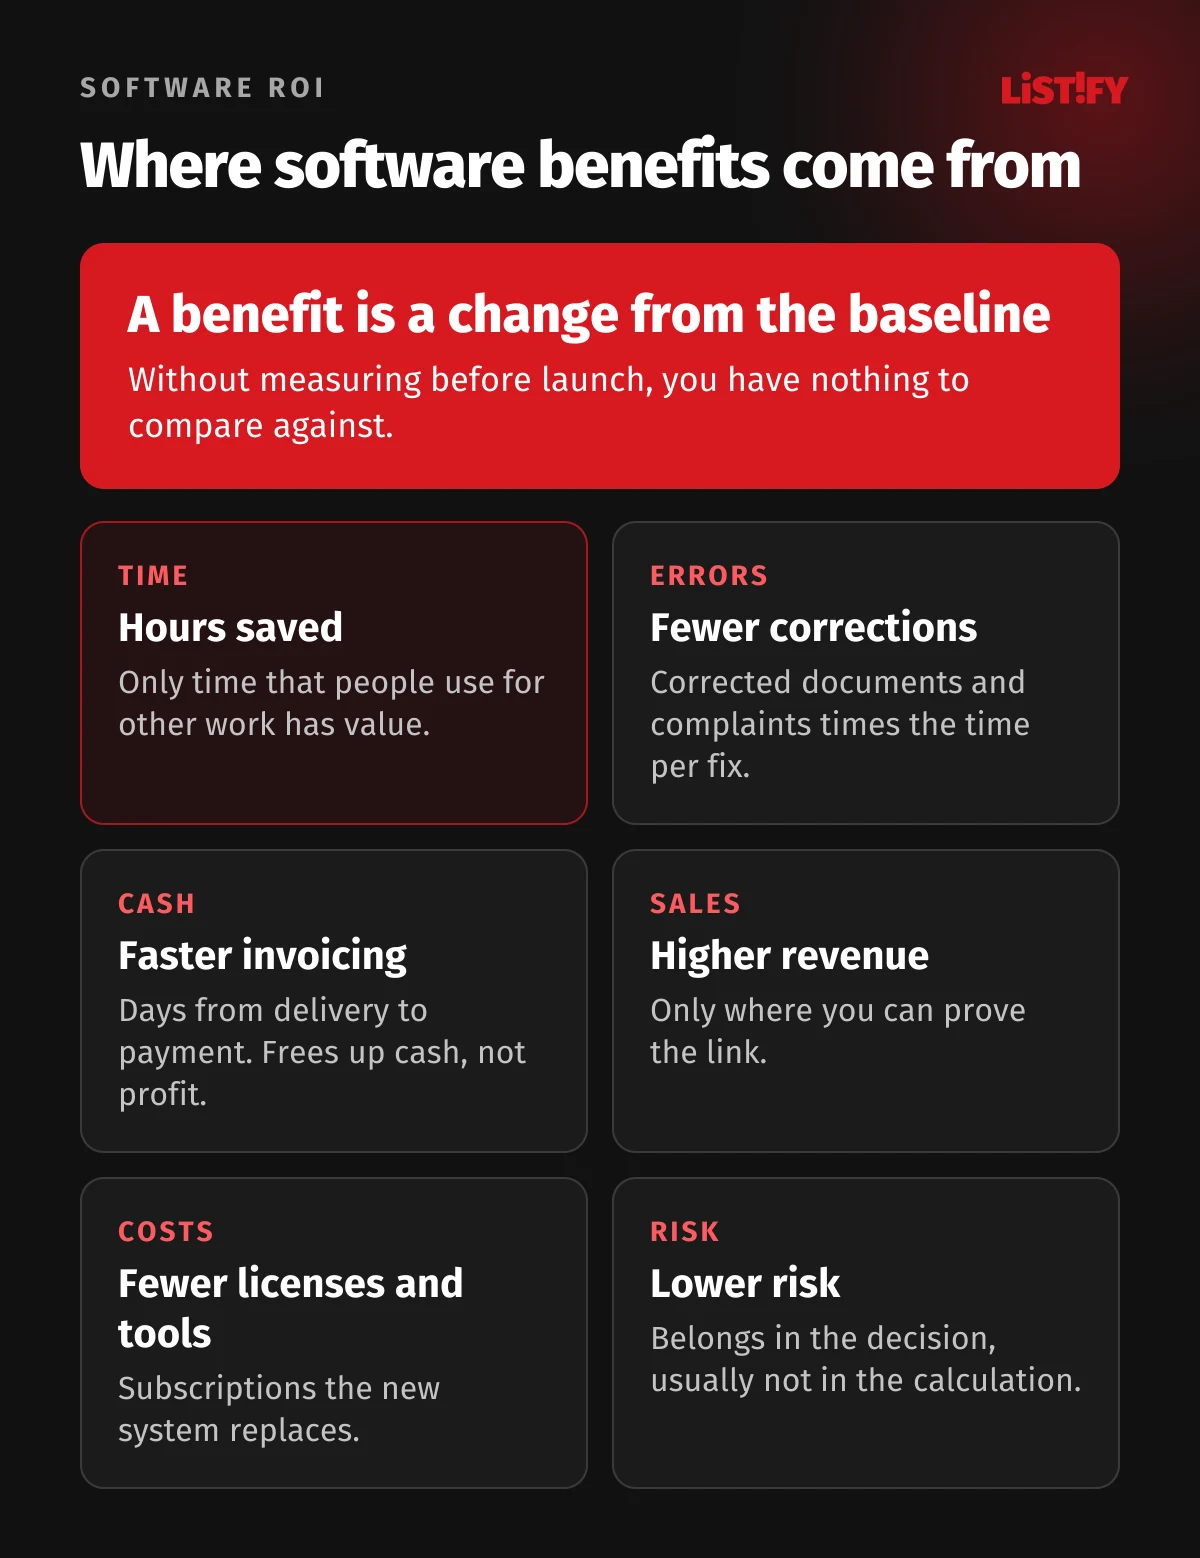
Time saved is the most common item and the most misleading one, so it gets its own section below. Fewer errors are valued at what corrections cost you today: credit notes, complaints, manual lookups. Spreadsheets are more error-prone than they look. Professor Raymond Panko reviewed field audits and found errors in 88% of the 113 spreadsheets audited, mostly large, business-critical ones. In 2003, Canadian power company TransAlta took a $24 million charge because of a cut-and-paste error in Excel.
Faster invoicing brings in cash, not profit. Late payment is getting worse across Europe. According to Intrum’s European Payment Report 2026, the gap between agreed payment terms and actual payment in business-to-business sales has widened from 16 days in 2023 to 20 days in 2026, and the share of revenue received late has risen above 12%.
If your system issues the invoice on the day of delivery instead of four days later and sends reminders automatically, the money arrives sooner. For a company with €3 million in annual revenue, invoicing four days sooner releases about €33,000 of cash, one time (€3M ÷ 365 × 4). That money would otherwise sit in receivables. Don’t count it as profit in your ROI. It’s money that would have arrived anyway, just later. The real benefit is the interest you save or the overdraft you no longer need.
Higher sales are the hardest to prove, because many things affect revenue at once. Only count them where you can show a link: fewer forgotten quotes, faster replies to inquiries, a higher share of repeat orders. Lower license and tool costs are the easiest to count: list the subscriptions the new system replaces. Lower risk (losing a key person, data loss, a fine) usually stays out of the calculation, but it belongs in the decision.
04An hour saved is not a euro saved
A typical vendor calculation looks like this: three people save five hours a week, an hour costs €35, so the business saves over €24,000 a year. But that money never shows up in your bank account. People keep earning the same salary. The saving only becomes real if the freed-up time goes somewhere useful: a salesperson calls more customers, you avoid a new hire, overtime disappears.
Even the authors of the best-known time-saving studies say so. In 2012, the McKinsey Global Institute estimated that knowledge workers in large organizations spend 28% of their time on email and 19% looking for information. The same report adds that the benefit only materializes if the time saved goes into productive work. Forrester, which prepares ROI studies commissioned by software vendors, counts only half of the time saved by default.
So what does an hour cost? Eurostat puts the average hourly labor cost in the EU business economy at €34.90 in 2025, including employer social contributions. The figure varies a lot between countries: it was €19.80 in both the Czech Republic and Slovakia. Our example uses €35. For your own calculation, use the actual pay of the people whose work will change.
Be careful with another number that circulates online: “40% of working time is spent on routine tasks.” What a 2017 Smartsheet survey actually found is that more than 40% of respondents spend at least a quarter of their week on manual, repetitive work. It surveyed about 1,000 people in the US, mostly from large organizations. The only number that matters for your calculation is the one you measure yourself.
05Measure the baseline before you start
Without a baseline, there is nothing to compare against. After launch, all you have is a feeling that “things are faster.” Two to four weeks before the project starts, measure:
- Time: how many hours per week the process takes and who does it. Log it for real instead of estimating.
- Volume: orders, invoices, inquiries or requests per week.
- Errors: how many documents get corrected and how many complaints come from bad data.
- Speed: how long from delivery to invoice, and how long to reply to an inquiry.
- Money: average days to payment and the amount of overdue receivables.
The UK Treasury’s appraisal guide, The Green Book, adds one more rule: describe the current state fairly. If you paint today worse than it is, you inflate the benefits of the new solution. It also recommends calculating a switching value: how far a key assumption would have to move before the project stops being worth it.
Measuring has a side effect, too. It often shows the problem isn’t where you thought it was, and your brief to the vendor gets sharper.
06Worked example: from an optimistic 244% to a realistic 29%
A fictional 20-person company receives orders by email. Four people retype them into a spreadsheet and then into the accounting software, about six hours a week each. On top of that, fixing incorrect invoices takes about 36 hours a year. That adds up to 1,140 hours a year. The company is considering a system that takes in orders, issues invoices and passes them to accounting.
| Input | Value | Source |
|---|---|---|
| Time saved | 1,140 hours a year | 4 people × 6 h × 46 working weeks + 36 h of corrections |
| Hourly cost | €35 | Eurostat EU average 2025, rounded |
| System development | €24,000 | indicative price for this scope |
| Your people’s time on the project and training | 80 hours | 60 h on the project + 20 h of training × €35 = €2,800 |
| Running costs and support | €3,600 a year | €300 a month, indicative |
| Changes from year 2 | €2,500 a year | small adjustments based on real use |
| Discount rate | 10% | required return, explained below |
The optimistic version
All time saved counts as money: 1,140 × €35 = €39,900 a year. The only costs counted are development and running costs. Over three years, ROI comes out at 244% and the investment pays back in about eight months. A number like that looks great in a proposal.
The realistic version
Now the same project with five adjustments: only half the time saved counts as value, the first year delivers only 75% of the benefit while people learn the system, your own people’s time is added to the investment, changes are budgeted from the second year, and future benefits are discounted to today’s value at 10%.
| Year | Benefit | Running costs and changes | Net cash flow | Cumulative |
|---|---|---|---|---|
| 0 (launch) | €0 | investment €26,800 | -€26,800 | -€26,800 |
| Year 1 | €14,962 | €3,600 | €11,362 | -€15,438 |
| Year 2 | €19,950 | €6,100 | €13,850 | -€1,588 |
| Year 3 | €19,950 | €6,100 | €13,850 | +€12,262 |
- InvestmentOptimistic model: 24,000Realistic model: 26,800
- Net benefit in a full yearOptimistic model: 36,300Realistic model: 13,850
- Net result over 3 yearsOptimistic model: 84,900Realistic model: 12,262
- NPV at 10%Optimistic model: 66,273Realistic model: 5,382
Fictional company, rounded values. The realistic model counts half the time saved, 75% of the benefit in year one, your own people’s time and changes from year two.
The project still pays off in the realistic version, just not as spectacularly. And it tells you more: an NPV of €5,382 means the investment could cost about 20% more before the project stops paying off. That safety margin tells you more than the ROI figure does.
Why 10%? The discount rate is the return you require from the investment. The floor is the risk-free return: the ECB deposit facility rate has been 2.5% since September 16, 2026. An investment in your own system carries more risk, so you add a premium. Forrester uses 10% in its ROI studies, for example the Microsoft 365 Copilot study. If you would have to borrow the money at a higher rate, use a higher rate.
We deliberately left out the one-time cash released by faster invoicing and the benefit of fewer customer-facing errors. If you can prove them, add them. If you can’t, treat them as upside and keep them out of the decision.
07Build in a buffer: IT projects overrun unevenly
McKinsey and the University of Oxford compared plans with outcomes for more than 5,400 IT projects. Large projects over $15 million ran 45% over budget and 7% over time on average, and delivered 56% less value than predicted. A small business is not running a $15 million project, but the principle holds: plans tend to be optimistic.
The spread matters more than the average. Bent Flyvbjerg and Alexander Budzier of Oxford studied 1,471 IT projects, mostly large US public-sector ones. The average cost overrun was 27%, but one in six projects overran by 200% on average. A later analysis by the same team, covering 5,392 projects, concluded that the distribution is so skewed that the average cost overrun for IT projects does not exist, meaning it cannot be calculated. Most projects land close to plan; a few go catastrophically wrong.
That is why the UK Treasury recommends an optimism bias adjustment when appraising public projects. For equipment and software development, the starting upper bound is +200% on capital cost and +54% on duration. It can only be reduced as far as the risks are demonstrably under control.
- Standard buildings24%
- Standard civil engineering44%
- Non-standard buildings51%
- Non-standard civil engineering66%
- Equipment and software development200%
Upper bounds for UK public projects, used as the starting point of an appraisal and reduced as risks are managed. These are starting points, and they differ from average overruns. Source: HM Treasury, Supplementary Green Book Guidance: Optimism Bias, table 1.
What it means for you:
- Split the project into smaller parts. Start with one process, measure it, then move on to the next. Smaller pieces overrun less, and you find out sooner whether they work.
- Ask for a fixed price for a clearly defined scope. An open-ended hourly rate puts all the risk on you.
- Work out how much overrun the project can absorb. In our example, it’s about 20%. If a 50% overrun would put you in trouble, make the project smaller.
- Don’t add features midproject. Handle extensions after the first part is live and measured.
You will often see the claim that “only a third of IT projects succeed.” It comes from the Standish Group CHAOS reports, whose methodology Dutch researchers criticized as producing misleading and meaningless figures. Leave it out of your calculation.
08Measuring after launch: 30, 90 and 365 days
A calculation before the investment is an estimate. The real return only shows up when you measure after launch, using the same metrics as the baseline.
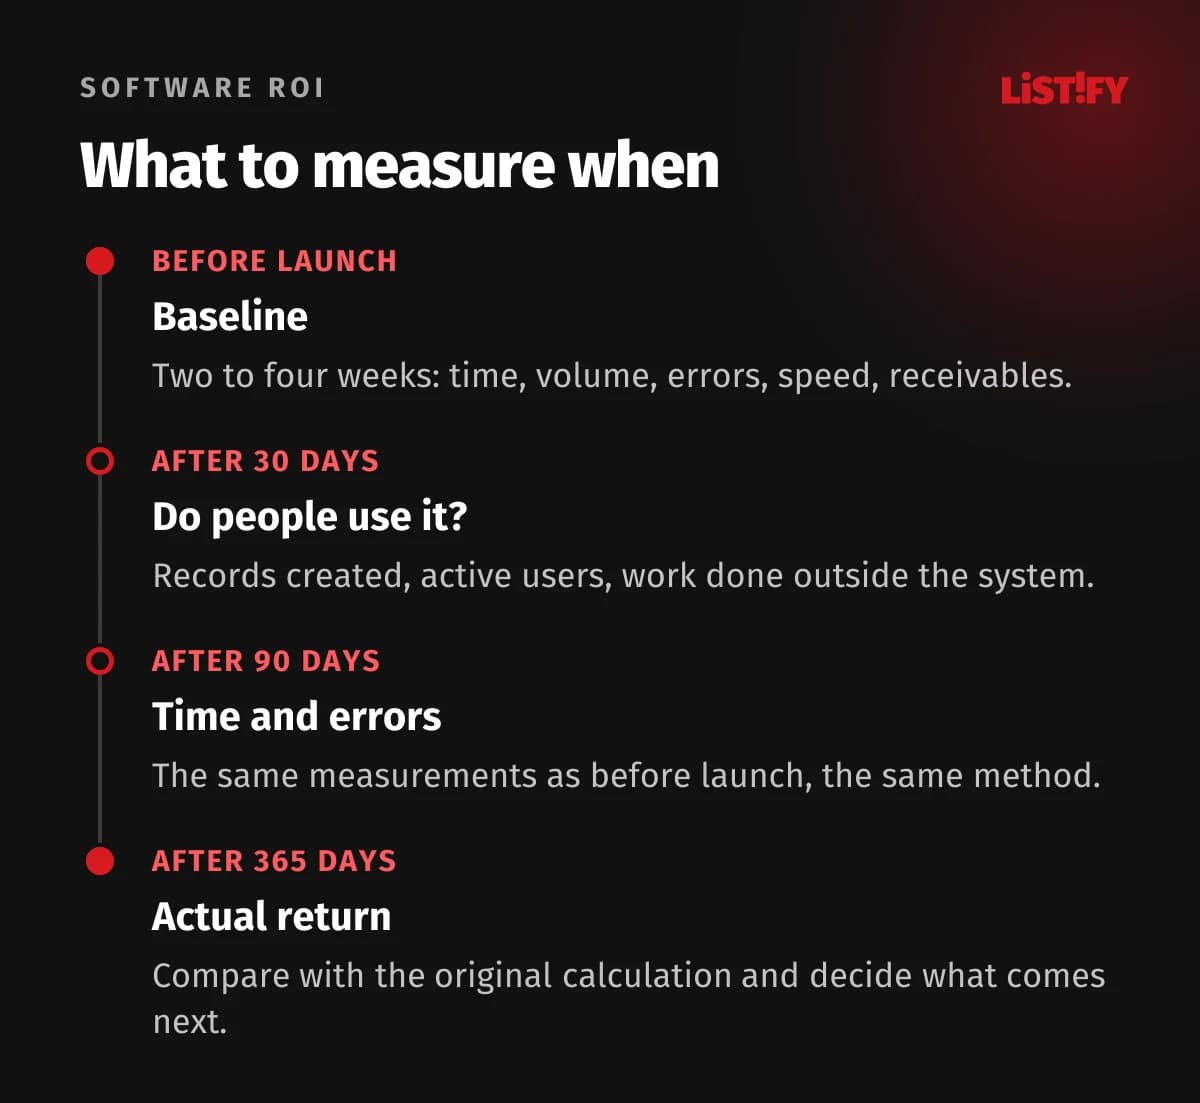
The 30-day check matters most. It shows whether people actually use the system. Software that sits unused delivers nothing, however good the calculation. Zylo, a company that manages software licenses, reports in its 2026 SaaS Management Index that organizations leave an average of 36% of their SaaS licenses unused. The data comes mostly from its large enterprise customers, but any business that has bought a tool nobody opens knows the problem.
If the numbers do not add up after 90 days, look for the cause before writing the project off. A common one is a workaround: people keep their own spreadsheet “just in case,” or part of the process stayed manual because one integration is missing. Fixing that is usually cheaper than starting over.
09Amortization and tax: keep them separate from cash
How software is treated for accounting and tax depends on the country, the price and whether you buy it outright or subscribe. Two examples from Central Europe show how much the rules differ:
| Situation | What applies | Source |
|---|---|---|
| Czech Republic, software acquired since 2021, company uses double-entry bookkeeping | Book amortization (called depreciation in local rules) is tax deductible; the company sets its own capitalization threshold and amortization schedule | Income Tax Act, § 24(2)(v)(2), Decree 500/2002, § 6 |
| Slovakia, software over €2,400 | Intangible asset, written off for tax in line with accounting rules; the tax depreciation groups apply only to tangible assets | Income Tax Act 595/2003, § 22(7) and (8) |
| Subscription software (SaaS) | Usually treated as an operating expense | depends on the contract and the nature of the service |
For the ROI calculation, one thing follows: base NPV and payback on actual cash payments in and out. Amortization affects when and by how much your tax bill drops, and you can add that as a separate step. The worked example above is therefore before income tax.
10Grants: a scenario, not a certainty
Public funding for going digital tends to come in waves. In the Czech Republic, the EU-funded Digital Enterprise program (OP TAK) has no open call as of October 2, 2026; the last one closed on April 17, 2026. In Slovakia, the digital vouchers from the Recovery Plan, which covered up to 85% of eligible costs (capped at €15,000), closed on November 24, 2023. Consultants’ websites still advertise both.
Whatever is available where you operate, model a grant only as a separate scenario. The project should pay off without it, because someone else decides whether you get it, and the paperwork and the obligation to keep the funded project running for several years cost time and money.
11When business software is not worth it
An honest calculation sometimes shows that the project makes no sense. Most often in these situations:
- The process is small. If manual work takes two hours a week, a custom system won’t pay back. A better spreadsheet or an off-the-shelf tool will do.
- The process is about to change. If you’re changing your business model next year, automate afterward.
- Nobody will own the system. Without one person responsible for it, adoption fades within weeks.
- The benefit rests on a single assumption. If the project only pays off when revenue grows by a third, it’s a bet, not an investment.
“Not now” is a good outcome too. It saves money and gives you a clear brief for when the time is right. If your real question is whether you have outgrown Excel, read When Excel is no longer enough.
12Questions to ask before you sign
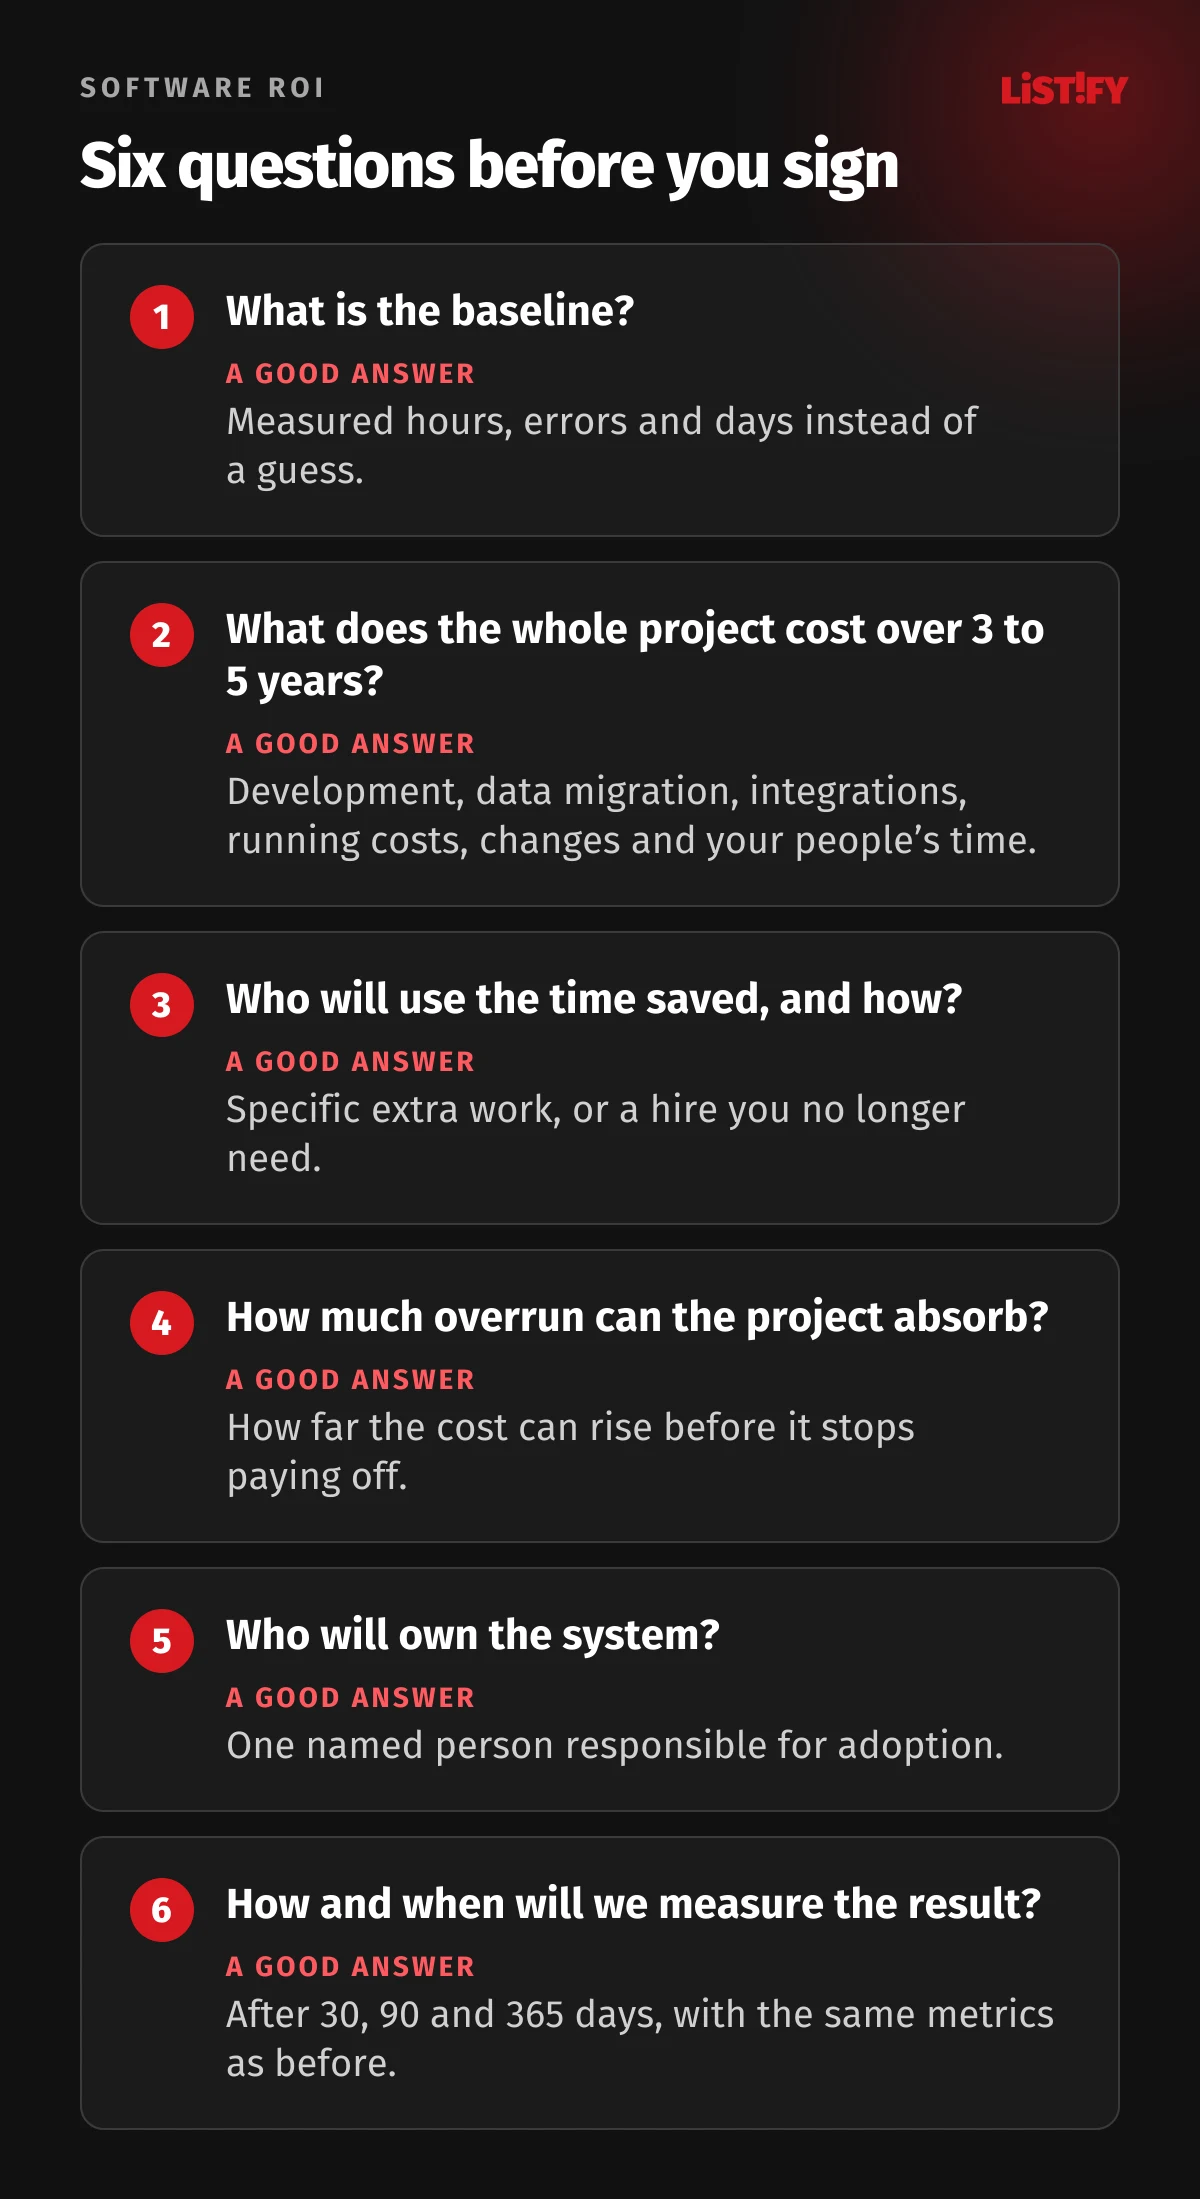
You can get a ballpark price for a custom system in our custom systems calculator. We describe how a project runs from analysis to launch on How it works. If the new system has to talk to your other tools, plan for what we cover in API integration best practices.
13Frequently asked questions
How do you calculate the ROI of software?
ROI = (benefits - costs) ÷ costs × 100%. If a system brings €40,000 in benefits over three years and costs €27,000, the three-year ROI is (40,000 - 27,000) ÷ 27,000 × 100% = 48%. Always state the period the ROI covers.
What is the difference between ROI and the payback period?
ROI tells you how much an investment earns. The payback period tells you how long it takes to get your money back. A project can have a high five-year ROI and still pay back slowly. That is why you should look at both, plus net present value (NPV).
What is a good payback period for business software?
There is no universal threshold. It makes sense for the investment to pay back well before the system needs a major rebuild. Many small businesses look for payback within two to three years, but set your own threshold based on cash and risk. More important than any single number is how much overrun the project can absorb before it stops paying off.
Should I count all the time saved?
No. Time saved turns into money only if people use it for other productive work, or if it means you do not have to hire someone. A conservative approach is to count half, as Forrester analysts do. Better still, document where the freed-up time will actually go.
How much does an hour of employee time cost?
According to Eurostat, an hour of work cost EU employers €34.90 on average in 2025, including employer contributions. In the Czech Republic and Slovakia it was €19.80, so the gap between countries is large. For your own calculation, use the pay of the people affected by the change.
When should you measure ROI after launch?
After 30 days, check whether people use the system. After 90 days, measure time and error rates the same way as before launch. After a year, compare actual benefits and costs with the original calculation and decide on further development.
14Sources
- Eurostat: Integration of internal processes (isoc_eb_iip)
- Eurostat: Labour cost levels (lc_lci_lev)
- Intrum: European Payment Report 2026, press release
- Corporate Finance Institute: ROI, payback period, NPV, IRR
- Gartner: Total Cost of Ownership
- McKinsey Global Institute: The social economy (2012)
- Forrester: Total Economic Impact methodology and Microsoft 365 Copilot study (PDF)
- Smartsheet: Automation in the Workplace 2017 (PDF)
- Zylo: 2026 SaaS Management Index
- R. Panko: What We Know About Spreadsheet Errors (archived)
- EuSpRIG: Horror Stories
- McKinsey: Delivering large-scale IT projects on time, on budget, and on value (2012)
- Flyvbjerg and Budzier: Why Your IT Project May Be Riskier Than You Think (PDF)
- Flyvbjerg et al.: The Empirical Reality of IT Project Cost Overruns (2022)
- HM Treasury: Optimism Bias (PDF) and The Green Book
- Eveleens and Verhoef: The Rise and Fall of the Chaos Report Figures (PDF)
- ECB: deposit facility rate
- Czech Income Tax Act, Slovak Income Tax Act
- API: Digital Enterprise (CZ), SIEA: digital vouchers (SK)
Data verified as of October 2, 2026. The Forrester, Zylo and Smartsheet reports are commissioned or published by companies that sell software or related services, so we only use their methodology and clearly labeled figures.