Product analytics: find out what people actually do in your app
Your app has active accounts, but you cannot tell whether customers are reaching the result they came for. Product analytics connects recorded behavior with specific decisions: where onboarding fails, which features support repeat use and whether a change improves the experience.
Start with a question, then define the events that can answer it. Installing an analytics SDK gives you a collection mechanism. It does not define activation, distinguish a successful task from a button click or explain why someone leaves.
Imagine a project-planning app whose team wants more trial accounts to finish their first shared project. The useful investigation follows project creation, invitations and successful collaboration. A growing total of page views could coexist with a completely broken invitation flow.
01Define the decision and the valuable action
Choose a small set of decisions your team will make in the next release cycle. Should onboarding ask for fewer details? Are invited teammates able to join? Does the new reporting feature help accounts return? Each question should point to a plausible product change.
Define activation as evidence that a new user or account received an initial piece of value. In a planning tool, creating an empty project may be only setup. Completing a shared task can be a stronger candidate. Validate the interpretation through customer conversations rather than assuming that the easiest event to track represents success.
Write the metric in a sentence that names its denominator and window: trial accounts created during the cohort period that complete a shared task within their first eligible week. State how you treat staff accounts, deleted accounts and trials that have not had enough time to finish.
User-level and account-level views answer different questions. A purchasing team may have one buyer and several occasional collaborators. Counting every seat as a failed daily user misreads a product intended for periodic collaboration. Choose a unit that matches the business model.
Keep a short metric dictionary with an owner and version history. When activation changes, preserve the old definition for comparisons or explicitly mark the break. A dashboard that silently changes meaning is difficult to trust, even when every query runs correctly.
02Create a tracking plan developers can implement
An event records a meaningful action; its properties describe the relevant context. Prefer project_created, invitation_accepted and task_completed over a collection of unrelated screen and button labels. The names should survive ordinary interface redesigns.
Amplitude event-selection guidance describes the relationship between events, properties and the questions analytics can answer. Use it as a reference for building a focused plan, rather than treating every detectable interaction as necessary data.
| Event | Record it when | Useful controlled properties |
|---|---|---|
| Project created | Creation succeeds and a project exists | Project type, plan tier, entry point |
| Invitation sent | The server accepts a valid invitation | Invitation method, inviter role |
| Invitation accepted | Membership is established | Role, invitation age category |
| Task completed | The stored task changes to completed | Task type, account plan, app version |
| Report exported | The requested export finishes successfully | Format, report type, entry point |
For each event, document the trigger, source, identity, required properties, allowed values and owner. Include an example payload with synthetic values. Specify whether it represents an attempt, a confirmed result or an error so analysts do not merge different meanings.
Record business completion where it can be confirmed. A click on Save proves intent, while a successful server-side save proves a stored outcome. You may need both to diagnose failure, but they should have distinct event names and a shared correlation strategy.
Manage event changes with the release process. Renaming an event casually can split a historical funnel. Additions, deprecations and changed property definitions should be visible to the team that maintains the reporting.
03Make identity and event quality reliable
Decide how anonymous activity becomes associated with an authenticated account. Review the platform behavior for identifying, merging and resetting users. An incorrect reset on logout can attach the next person on a shared device to the previous account.
Separate the person identifier from the organization identifier. A consultant may belong to several workspaces, and a team member may use both a personal and a business account. Store the workspace context of the event rather than assuming a person has one permanent organization.
Use event identifiers where retries can produce duplicates. Mobile clients may queue events offline, and server jobs may retry after ambiguous responses. Document which timestamp represents the activity and which represents ingestion, then account for late-arriving events in reports.
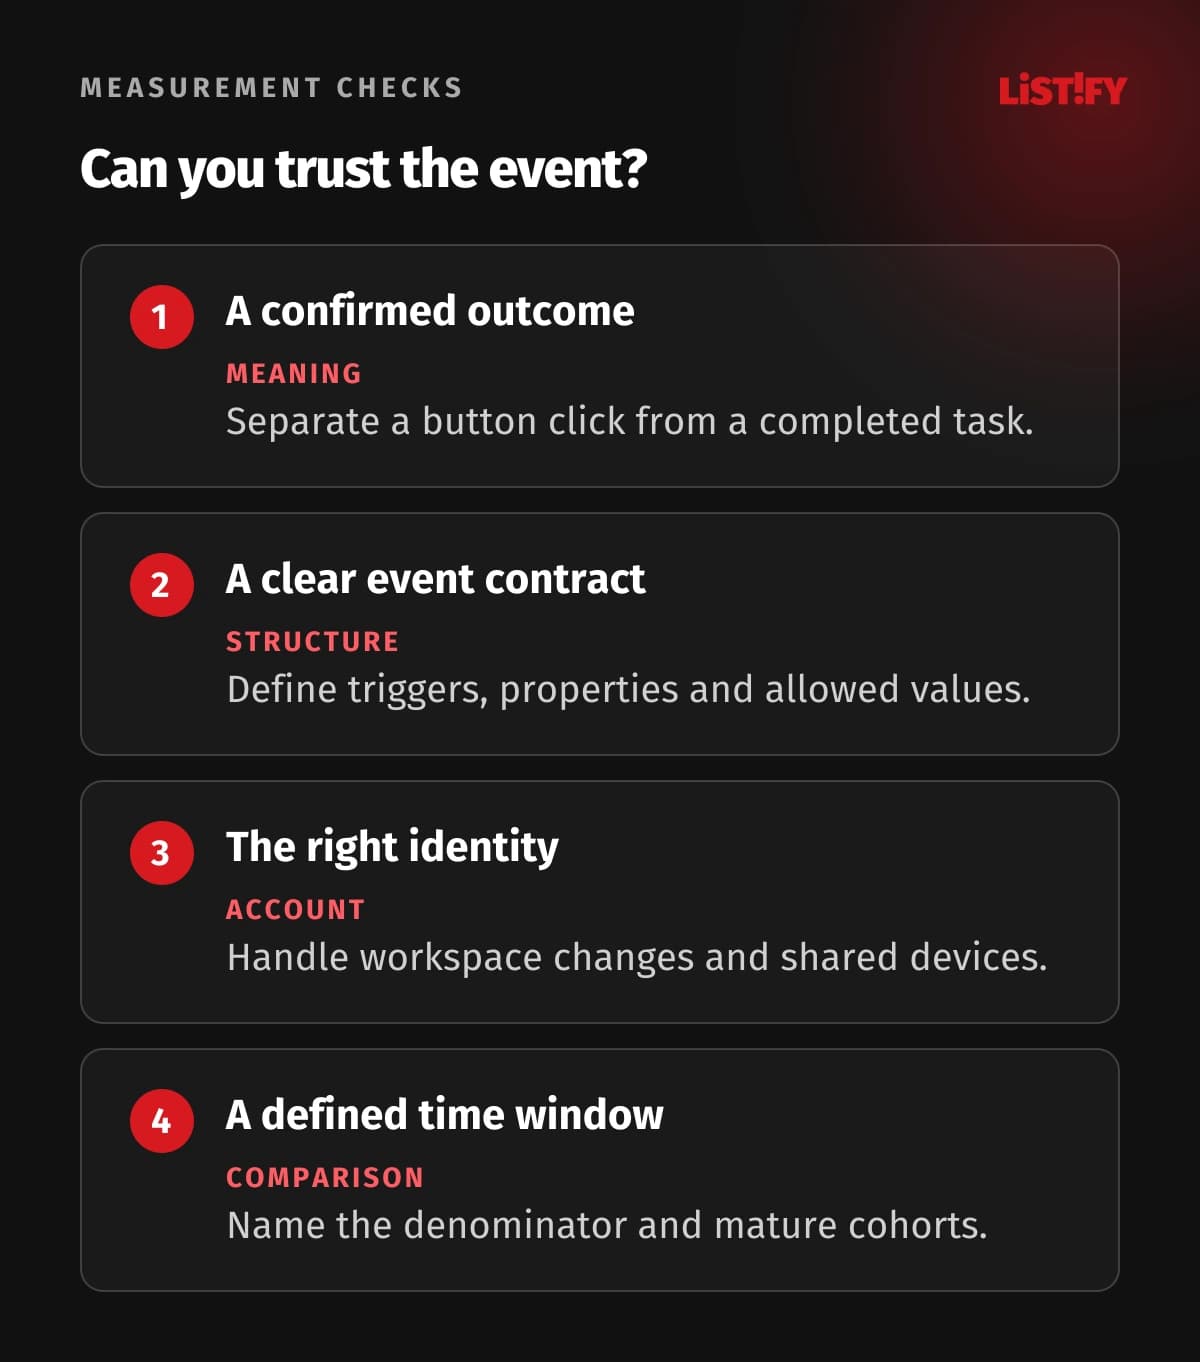
Validate against a controlled journey before launch. Create a project, send an invitation, accept it and complete a task with test accounts. Compare the recorded sequence with the application state. Also try failed actions, reloads, duplicate clicks, account switching and an offline session.
Watch for missing properties, unexpected values and sudden volume changes after releases. A chart may drop because customers struggle, because an event stopped firing or because the team changed its name. Check instrumentation health before making a product decision.
04Use funnels to find the next investigation
A funnel counts progression through a defined sequence within a chosen period. In the planning example, start with trial account creation, then a real project, an accepted invitation and a shared task. Explain which steps require the same account or object.
Amplitude funnel interpretation documentation explains that event order, conversion window and counting choices affect the results. Record these settings beside the chart; two reports with identical step names can still answer different questions.
Look for the stage with a meaningful loss, then break it down by a small number of plausible contexts. App version, entry point or account plan can reveal an implementation issue. Avoid slicing a small sample into so many groups that a few users look like a dependable pattern.
Time to completion matters as well as completion itself. A workflow people finish after several support exchanges may deserve attention even if its final conversion looks healthy. Compare the observation windows and allow recent cohorts enough time to mature.
A drop-off tells you where to investigate, not why it happened. Combine it with usability sessions, support themes and the relevant error data. The onboarding guide provides related context for reducing early friction.
Check the underlying examples before accepting a surprising result. If an invitation appears accepted before it was sent, inspect identity stitching, event timestamps and the funnel configuration. An apparently impossible journey is often a useful data-quality clue.
05Measure retention around the product rhythm
Retention asks whether a defined group returns to a defined behavior. Select a start event, a return event and an interval appropriate for the product. A monthly reporting tool and a daily study app should not share the same interpretation of daily activity.
Amplitude retention timing documentation distinguishes return-on from return-on-or-after measurements and calendar-based intervals from rolling windows. State which definition your chart uses before comparing cohorts.
Exclude immature periods from confident conclusions. A cohort created yesterday cannot demonstrate a completed monthly return window. Mark partial data clearly instead of interpreting its lower value as an immediate retention problem.
Compare cohorts with relevant context such as onboarding route, account type or release exposure. A rise in paid accounts can change the aggregate even when each subgroup behaves similarly. Ask whether the mix of users changed before attributing a shift to a feature.
People who use a feature may retain better because they already have stronger needs. That association is a hypothesis, not proof that exposing everyone to the feature will improve retention. A controlled experiment, where suitable, can test the proposed causal relationship.
Maintain a view of successful recurring outcomes. App launches are helpful operational context, but customers may open the app because something failed. The web app UX guide connects recurring use with a usable task flow.
06Protect the data and turn findings into changes
Limit properties to what the decision needs. Customer document titles, search text, emails and free-form support messages can contain sensitive information. An internal identifier may still be personal data when it can be linked back to someone, so pseudonymization is not a general privacy exemption.
Google Analytics guidance on avoiding PII prohibits sending information Google can recognize as personally identifiable and highlights URLs, titles and entered text as potential sources. Apply the chosen provider policy alongside your jurisdiction-specific privacy requirements.
Review access, storage location, retention and deletion with the actual tool configuration. Session replay needs its own evaluation of masking and exclusions. Seeing an empty password field in one test does not establish that every sensitive interaction is protected.
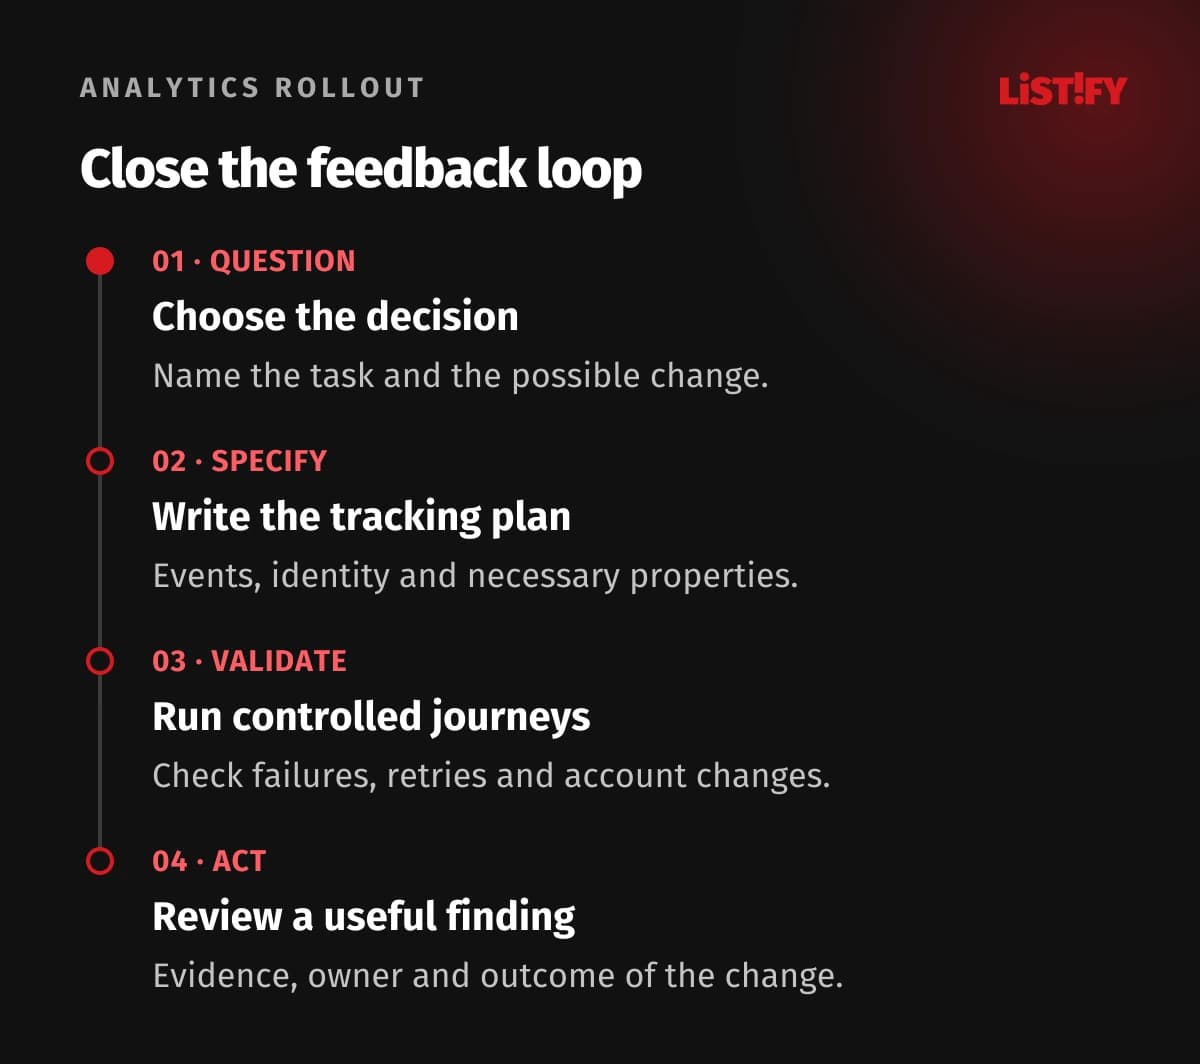
For each finding, record the evidence, competing explanations, next action and owner. A team might shorten an invitation form, then check successful invitation acceptance and support requests. Keep a clear link between the change and the metric it should influence.
Review a compact set of actionable reports regularly. Retire unused events and explain metric changes. The deliverable is a better decision and a trustworthy feedback loop, not an ever-growing wall of charts.
07Questions about a first analytics implementation
Which analytics tool should we choose?
Choose after defining the decisions, identity model, privacy requirements and needed analyses. Compare implementation effort, data ownership, export options and operating costs. A familiar dashboard cannot compensate for events whose meaning is unclear.
Should we track every click automatically?
Automatic capture can help exploration, but it needs review and limits. Stable business events give important metrics a clearer meaning. Unfiltered capture can collect unnecessary content and create noise when interface labels or markup change.
Can the server record every event?
The server is suitable for confirmed business outcomes such as stored changes. Client events explain interface exposure and attempts. Use the appropriate source for each question and prevent duplicate counting when both describe one action.
Why do two dashboards disagree?
Compare identity, filters, time zones, conversion windows, event order and counting units. Check late events and duplicate handling. Similar chart titles do not establish that the underlying definitions are identical.
Does analytics explain why someone left?
Recorded behavior narrows the investigation. It rarely establishes motivation on its own. Combine it with relevant interviews, usability observation, support evidence and error information before changing the product.
Is an anonymous identifier outside privacy requirements?
Do not assume so. An identifier can remain linkable to a person or account. Review the data and processing under the applicable rules, provider terms and real configuration, including access, retention and deletion.
What is enough for the first release?
Instrument one important journey with clear events, identity and a tested completion outcome. Add an activation view, a funnel and a retention definition appropriate for your product. Expand when a concrete decision needs more information.