Customer journey mapping: Find where customers drop off
People visit your website, explore the offer and sometimes disappear. The number of exits alone cannot tell you whether they hit a barrier, are comparing options or have already completed their task. A customer journey map connects their goal, actions, questions and the available evidence. It helps you choose a specific problem to investigate and an improvement whose outcome you can assess.
01What a customer journey map actually helps you decide
Analytics shows unfinished orders. Support reports recurring questions about delivery. Sales says customers need more time. Each team sees a different part of the experience. A journey map brings those views together around a particular customer situation and exposes what you still do not know. A useful map leads to a decision and a named owner for the next step, rather than ending as a colourful presentation.
Nielsen Norman Group describes journey mapping as representing a person's progress towards a specific goal. Keep one perspective and one scenario in each map. The map describes the experience; a conversion funnel counts progress through selected steps. Both views are useful, but neither explains every cause on its own.
A third tool is the service blueprint. It adds the people, systems and internal activities that make the service happen. If a customer cannot find out when a parcel will arrive, the journey map records that uncertainty. A blueprint helps identify who produces the delivery estimate and where it gets lost between the warehouse, carrier and email. Some barriers require operational changes as well as website improvements.
02Start with one person, one goal and one decision
“Map all our customers” is too broad a brief. Instead, choose a first-time shopper buying an office chair who needs to confirm delivery before next week. A business making a repeat purchase of ten chairs needs a different map. Its decision process, available information and approval requirements are different. Grouping customers by the task they need to complete is often more useful than grouping them only by age or gender.
Write a working statement: We want to understand why this group cannot complete this task in this situation. Add a beginning, an endpoint and a time frame. The beginning need not be the first website visit. It might be a broken chair, a colleague's recommendation or an expiring contract. The endpoint might be successful assembly or a resolved support request, rather than payment alone.
Then name the decision the map should support. Are you improving delivery information, simplifying an enquiry or redesigning the whole purchasing process? A narrow decision calls for focused research. A broader change requires more scenarios and dependencies to be investigated. Put these boundaries on the map itself so that a later reader does not mistake one group's experience for a description of the entire business.
03Gather evidence from across the business
Start by listing what you already have: analytics event definitions, research notes, return reasons, support enquiries, lost proposals, telephone enquiries and known technical issues. Record each source's period, customer group, collection method and limitations. An old survey about a different product range may suggest a question, but it is not current evidence about the checkout you are changing today.
Include marketing, sales, support and operations. Ask for specific situations: What did the person ask? What answer did they receive? What happened next? Turn “customers do not understand it” into a problem you can investigate, such as confusion between stock availability and a delivery date. Include successful experiences too. They can show what helped someone complete the task and prevent you from removing a useful part of the process.
Complaint counts are not enough. Support mainly sees people who contact it and may miss people who leave quietly. Analytics may not connect a telephone conversation to a later order. Alongside your evidence inventory, maintain a list of gaps. For each important unknown, choose the smallest sensible investigation: an interview, observed task, measurement check or review of specific cases. Collecting more data is only useful when it answers a decision you need to make.
04Separate observations, interpretations and hypotheses
Ask interview participants about their most recent real experience. When did the need arise? What did they try before visiting the website? Where did they look for an answer? What happened afterwards? Let them describe the sequence and, where appropriate, show supporting material. “Would a better search feature help?” already proposes a solution. “How did you look for that model?” reveals both the approach and the obstacles.
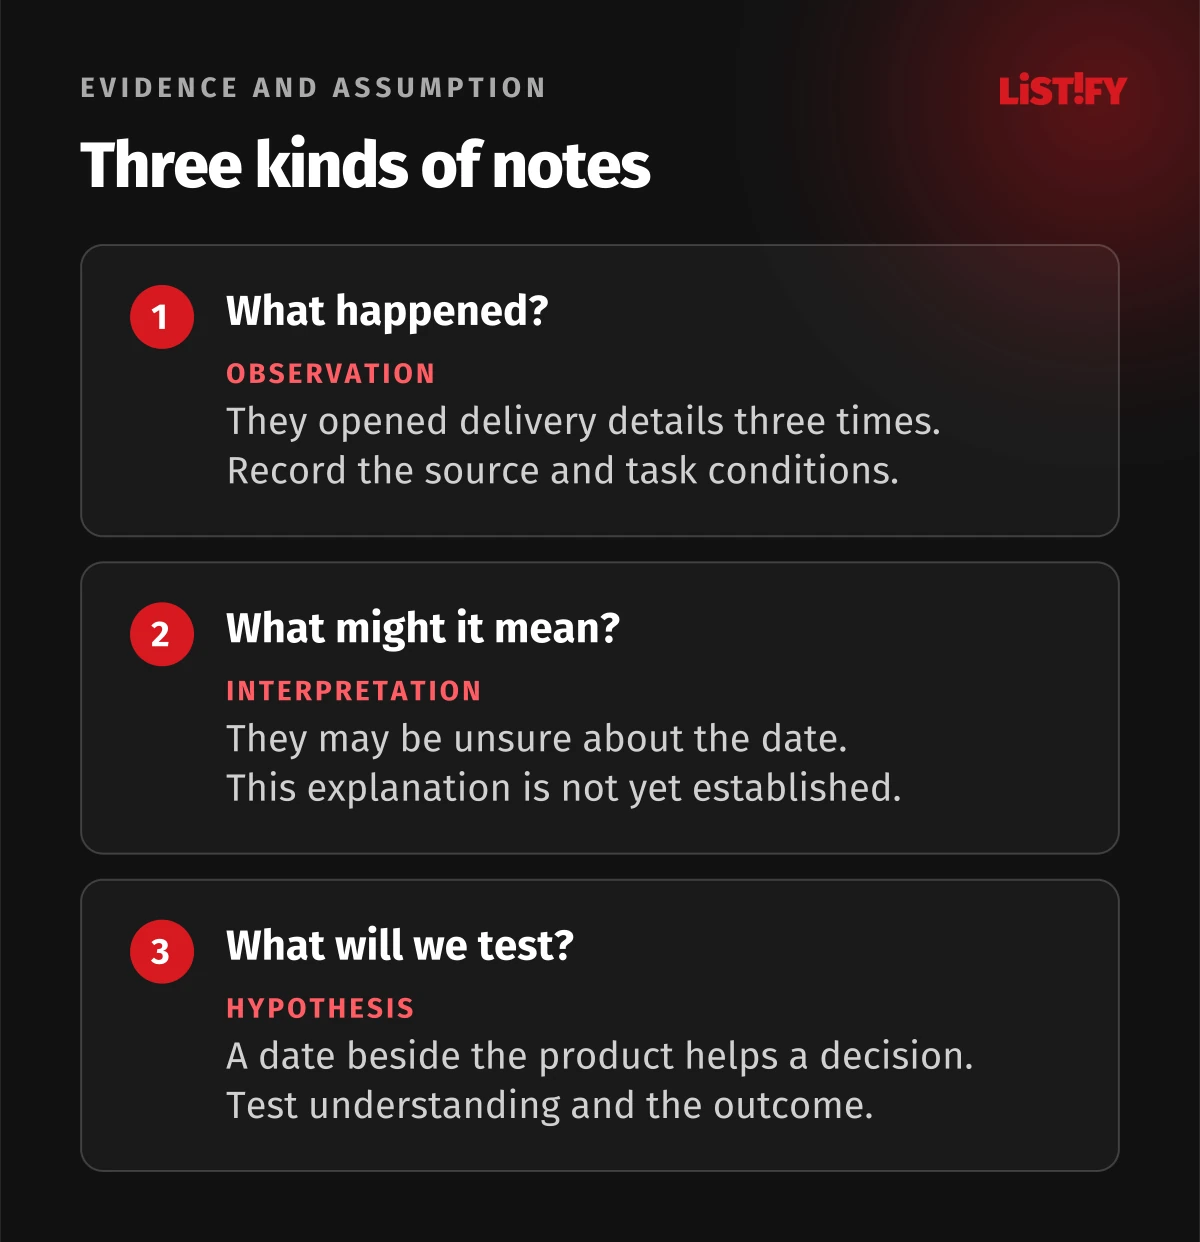
Label each note. An observation might be “the participant opened delivery information three times”. An interpretation is “they may be uncertain about the date”. A hypothesis to test is “a clear date beside the product will help them decide”. Do not turn your interpretation into a customer quotation. Record emotions from what the person said or from specific behaviour, with a note explaining how you reached the interpretation.
It is acceptable to begin with assumptions if they are clearly identified. Mark the map as hypothetical, add open questions and revise your confidence as evidence arrives. A small set of interviews may reveal a useful mechanism without telling you what percentage of customers experience it. Claims about prevalence require appropriate data and attention to how people were recruited. A workshop consensus is a team belief, not a substitute for customer research.
05Build a map the team can read and use
Use columns for the stages of your chosen scenario. Use rows for customer actions, questions and needs, touchpoints, evidence, barriers and opportunities. A touchpoint can be a product page, a telephone call, a confirmation email or the packaging that arrives at someone's door. Add an owner and a next decision to each opportunity. Use language that describes the customer's task, rather than internal department names.
Keep a traceable reference, date and access restrictions for supporting evidence. An anonymised summary is usually enough for the shared map. Everyone who helps prioritise work does not need access to full interview recordings. Do not rely on colour alone to show confidence or status. Add explicit labels such as “observed”, “hypothesis” and “tested” so that the meaning survives printing, copying and different viewing conditions.
Map the current experience first. Keep an intended future experience separate, otherwise the team can start treating a proposed feature as something customers already have. If the map needs dozens of tiny interactions and nobody reads it, split it into an overview and a detailed investigation of the difficult section. The overview supports shared decisions; the detail helps the person responsible for solving the problem.
06Worked example: From choosing a chair to using it
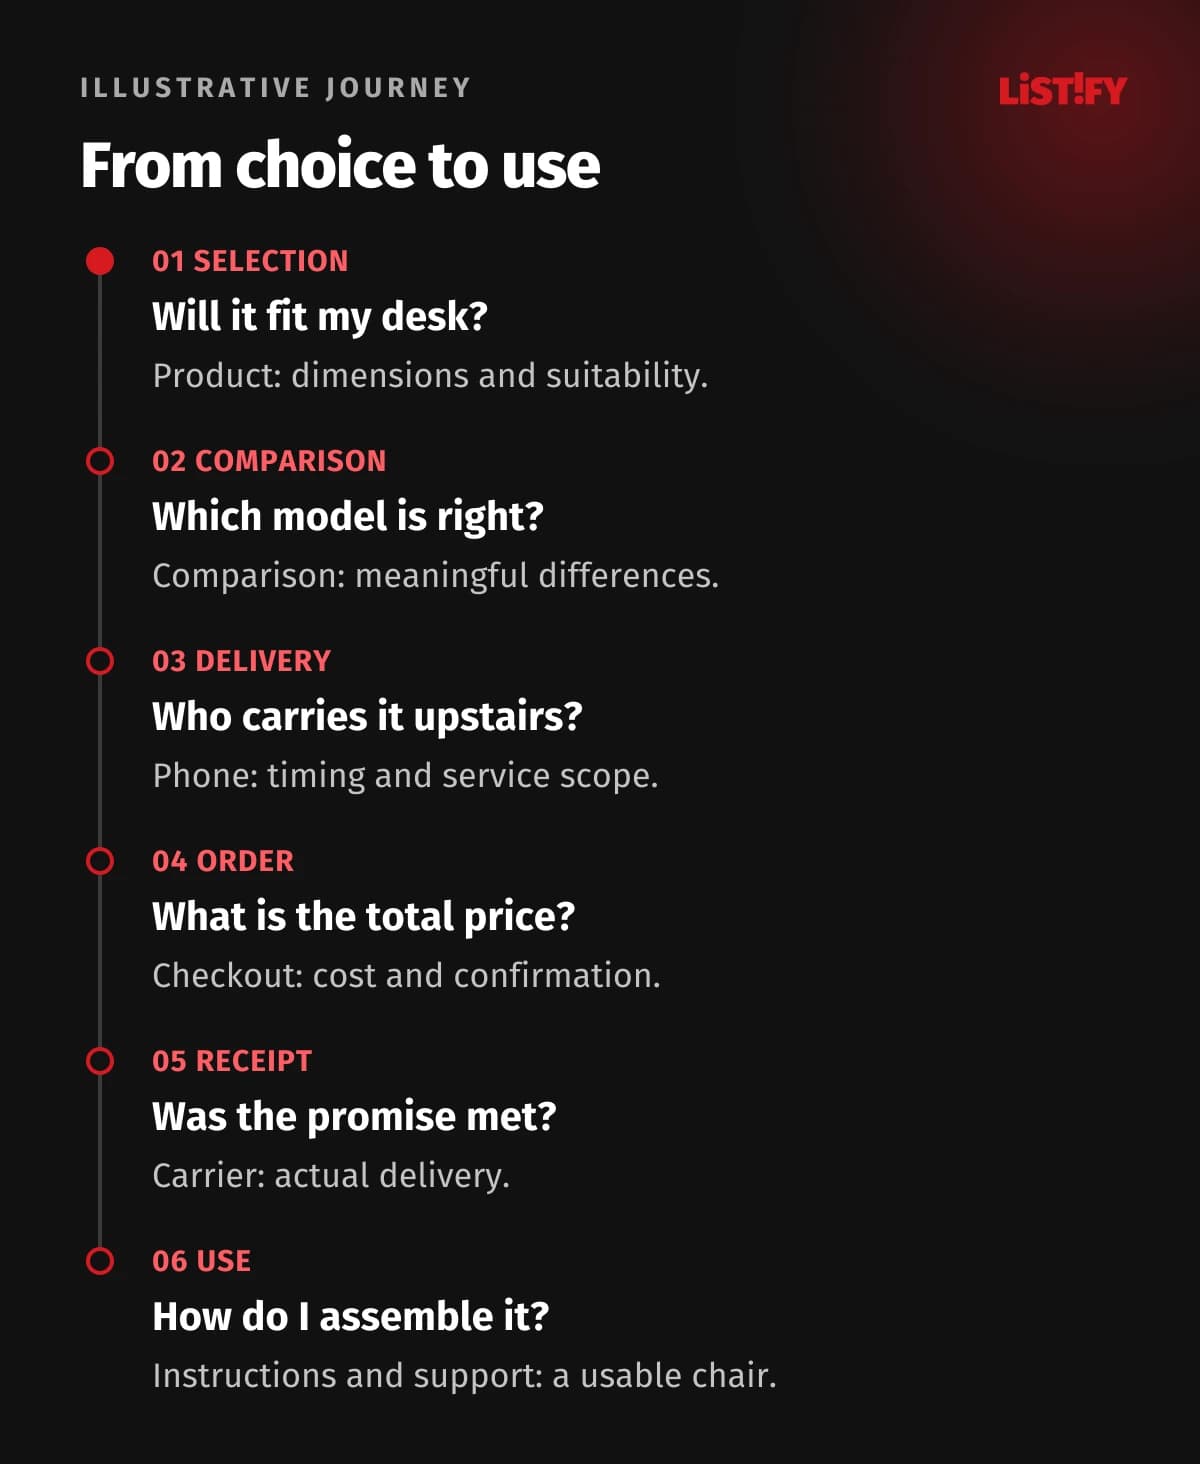
The following is an illustrative scenario created for this article, not Listify research or a real client's results. Jane is buying her first chair for a home office. She wants to choose a suitable model, confirm delivery and assemble it successfully. She starts browsing on her phone in the evening, compares dimensions on a computer the next day and calls to ask whether delivery includes carrying the chair upstairs.
The table contains possible questions and suggested ways to investigate them. These are not measured findings. This is what an initial map can look like before research. It shows the team which information it needs and where the website overlaps with human support. If interviews later reveal a different sequence, change the map instead of forcing customers' experiences into the template.
| Stage | Possible question or barrier | What to investigate | Responsible role |
|---|---|---|---|
| Selection | Will the chair fit my desk? Dimensions are unclear. | Observe selection and understanding of dimensions. | Product and content |
| Comparison | How do the two models differ? | Test a comparison task and review support questions. | Product and UX |
| Delivery | When will it arrive, and who carries it upstairs? | Compare customer questions with the carrier service. | Logistics and support |
| Order | Does the total price match what I expected? | Check understanding of the total and checkout flow. | Ecommerce and analytics |
| Receipt | Are the promised date and service scope met? | Compare the promise, confirmation and actual delivery. | Logistics |
| Use | Can I assemble it and resolve a missing part? | Test the instructions and support process. | Product and support |
The connections matter. A clear checkout does not solve the problem if the confirmation email promises a different date or the carrier cannot provide the requested service. Payment is an intermediate step in this scenario. The customer's goal is reached when a usable chair is in the right place. Include the people responsible for delivery and support in the work, and make sure the same promise is understood at each handover.
07Allow for returns, device changes and offline activity
Draw the journey clearly without assuming everyone moves from left to right. Someone may return from their basket to the catalogue, share a link with a partner, call the business and revisit several days later. Show important loops and branches alongside the main sequence. For complex purchases, distinguish the person choosing a product from the person paying for it or approving the budget.
Leaving the website does not always mean failure. Someone may have found opening hours and decided to visit the shop. Another person may correctly conclude that the product does not meet their needs. Judge success against the purpose of the task. An unnecessary form or a pressured purchase is not a better experience simply because it creates an extra recorded conversion. Consider what a sensible outcome looks like for the customer and the business.
Acknowledge measurement boundaries between channels. Without a reliable and appropriate identifier, you do not know whether a mobile visitor and a later caller are the same person. Do not join them by guesswork. Use aggregate operational information and research into real cases. If your map raises a channel question, our guide to an ecommerce app versus a better mobile website can help frame the next decision.
08Design measurement around the task and privacy
Before building a dashboard, define what your events mean. Does “order” mean clicking a button, the server accepting an order or a successful payment? How do you handle repeated submissions, cancellations and test traffic? Your analytics owner and commercial team need to count the same thing. Check several known test journeys and compare analytics with the operational system. A disagreement may reveal a definition problem rather than lost customers.
Collect the information required for the decision, rather than everything that is technically available. Keep email addresses, phone numbers and free-form customer messages out of event names, URLs and parameters. Google's Analytics data safeguards prohibit sending personally identifiable information. For behaviour recordings, configure masking, access and retention for the specific tool and purpose. Check that sensitive fields remain protected after interface changes.
Test measurement when people grant, refuse and change consent. Consent mode communicates consent status to tags and adjusts their behaviour; it is not itself a consent banner. A technical feature does not establish legal compliance on its own. Explain which parts of your analysis are observed, which are modelled if applicable, and which parts of the journey remain unobserved. Do not describe an incomplete measurement view as a complete customer record.
09A numerical example: Locate the drop without inventing a cause
These figures are invented to demonstrate the calculation. Consider a closed cohort of 1,000 measured users who first enter the product step during a seven-day recruitment period. Give each person seven days from entry to finish, and analyse only after the final window has ended. Count each person once, in the defined order: product, add to basket, begin checkout, confirmed order. This avoids giving later arrivals less time to convert.
Of these users, 600 add to basket, 240 start checkout and 180 complete an order. Completion between consecutive steps is 60%, 40% and 75%. Overall completion is 180 / 1,000 = 18% of the cohort. The absolute losses are 400 between product and basket, 360 between basket and checkout, and 60 before completion. The largest numerical loss and largest percentage loss are therefore in different places.
- Product1,000
- Add to basket600
- Begin checkout240
- Confirmed order180
Invented example, not Listify or client data. Closed cohort of 1,000 measured users; counted once, in the same sequence, within 7 days of entry. Analysed after all windows end. Bars show counts, not reasons for leaving.
The funnel does not tell you that delivery concerns caused 360 people to leave. They may have been comparing, encountered unavailable stock, hit a measurement gap or faced another problem. Return to your map and evidence to investigate. In GA4, open and closed funnels differ in where people are allowed to enter. Record sequence and time-window definitions beside the report so that another analyst can reproduce its meaning.
10Compare equivalent groups and use the right denominators
The example's 18% applies to its specified measured cohort, not to every website visit. Do not mix users, sessions, events and orders. One person can create several sessions and orders. Changing the unit or entry definition changes the question the number answers. Record the numerator, denominator and period for every rate. A label such as “conversion rate” is not precise enough to make two reports comparable.
Separate relevant groups before comparing: new and returning customers, devices, markets, product types or acquisition sources. Avoid slicing so finely that only a handful of cases remain. Two purchases out of four versus three out of four creates a large percentage difference, but it is not a reliable prediction for next month. Show the number of observations beside the result and acknowledge uncertainty. More decimal places cannot compensate for a tiny sample.
A change in traffic mix can alter the overall rate without any individual journey getting worse. Note seasonality, promotions and consent-banner changes too. Check GA4's data quality indicator; Explorations can be affected by sampling and data thresholds. Research recruitment, anonymous visits and unobserved returns add further limitations. The absence of a recorded step does not prove that the customer never took it, especially when the journey crosses channels or devices.
11Choose an opportunity by impact and confidence
Turn each barrier into a short problem statement: who is prevented from achieving which goal, what evidence supports that conclusion and how improvement would be recognised. Then consider severity, likely reach, strength of evidence, effort and dependencies. A broken payment flow may require immediate repair. A weakly supported navigation idea may call for a small research exercise. A single universal score cannot replace judgement about these different situations.
In the chair example, an opportunity might be to show realistic delivery options before checkout. First establish whether the business can reliably provide that information. An appealing promise without a dependable connection to stock and carrier services only moves the problem into complaints. The owner may therefore be a product manager working with operations, rather than a designer alone. Give the owner authority to resolve the dependency, not merely responsibility for updating the map.
Do not prioritise solely by the largest funnel loss. Consider whether people intended to continue, whether the problem is fixable and what side effects the change may create. When trust is the issue, identify the exact doubt and the evidence that would address it. Our guide to testimonials, case studies and reviews explores that decision. Adding more logos without answering the customer's question may leave the barrier untouched.
12Turn the opportunity into a testable improvement
Write a hypothesis that can be disproved: If people can see a clear delivery date and service scope earlier, they will be less uncertain when deciding. A prototype task asking participants to choose suitable delivery may be the first test. Observe whether they find and correctly understand the information. Whether they say they like the design is not enough to establish that the underlying problem has been solved.
With sufficient traffic, a controlled experiment may be appropriate next. Define the primary metric, guardrail measures, evaluation period and decision rules in advance, based on the sensitivity the test needs. Alongside order completion, monitor cancellations, support contacts or missed delivery promises. The aim is not to win orders through a claim the team cannot fulfil. Record other changes that could affect the result, and avoid treating every early movement in the numbers as a conclusion.
For low traffic, combine observed tasks, interviews and gradual rollout with operational checks. A simple before-and-after comparison is not automatically evidence of causation. Campaigns, stock and seasonality may also change the result. Update the map with what was supported, what remains unclear and whether the original barrier disappeared or merely moved to the next stage. An inconclusive result is useful if it prevents a larger unsupported investment.
13A practical checklist and ownership of the next step
Bring evidence to the first workshop instead of starting with an empty board. Make room for different interpretations and do not fill gaps by voting. Afterwards, the team should know what is supported, what needs investigation and who will act next. A shared document with a table and links may be sufficient for a small team. A more elaborate tool does not improve the quality of the underlying evidence.
- Does the map have one clear group, scenario, beginning and endpoint?
- Are the current experience and proposed future experience separate?
- Do important notes have a source, date and confidence label?
- Does the map cover support, offline steps, returns and use after purchase?
- Do metrics specify the unit, denominator, sequence and time window?
- Has measurement been checked, including consent, duplicates and known gaps?
- Does the chosen opportunity have an owner, test and guardrail measures?
- Have you agreed when to update the map and who will record the outcome?
Name a map owner, owners for individual opportunities and a review date. Match the regular review rhythm to the business, and revisit the map after material changes to the offer, checkout, channel or support process. Keep a version date and a short decision log. Otherwise, months later, the team may be unable to tell which conclusions still apply or why an improvement was made in the first place.
Listify's Digital marketing service describes audits, GA4 measurement, CRM integration and optimisation. If you need to connect a customer journey with measurement and website changes, start with a specific scenario and the evidence already available. The scope should follow the problem, not the number of boxes in a map or a promised conversion increase before the work has begun.
14Frequently asked questions about customer journey maps
Are journey maps only useful for large online stores?
No. A small store, service business or B2B enquiry process can benefit when you need to understand several connected steps. Choose a narrow scenario you can influence. For a small team, a clear table with evidence, one priority and a named owner may be enough. The size of the diagram is not a measure of its usefulness.
How many interviews do we need?
There is no single number for every scenario. It depends on how varied your customers are, the importance of the decision and what you already know. Recruit in stages and assess whether meaningful new problems are emerging. Use interviews to understand experiences; do not infer the percentage of all customers affected from an unrepresentative sample.
Can we build the map using GA4 alone?
GA4 helps describe measured behaviour, but it does not know customer motivations and may miss offline activity or return visits. Add specific experiences from research and operations. If other evidence is unavailable, mark proposed reasons as hypotheses and plan how to investigate them. A complete-looking map should not hide missing evidence.
What if we have too few orders for an A/B test?
Start with observed tasks, prototype testing and a measurement check. You can then introduce changes gradually and monitor operational effects. Do not label small fluctuations as a proven improvement. The strength of the available evidence matters more than producing a percentage result at any cost.
Should we fix the stage with the biggest drop first?
Not automatically. Check absolute numbers, relative rates, customer intent and measurement quality. High departure rates may be expected while people compare products. A smaller group blocked by a broken payment flow may represent a more urgent and better-supported problem.
Can a journey map include customer emotions?
Yes, when they are supported by a statement or specific observation and any interpretation is labelled. A downward curve drawn by the team without evidence is a hypothesis. The map should make clear where the conclusion came from and what still needs to be investigated.
How do we know the map has served its purpose?
The team has selected a specific barrier, assigned an owner, investigated it and used the outcome to improve the service or decision. Your initial idea does not have to be confirmed. Discovering that a planned investment addresses the wrong problem can also be valuable. Update the map to reflect what you learned.