Predictive analytics: Anticipating customer behaviour and demand changes
One month a product is unavailable; the next it sits in stock. Salespeople meanwhile call customers who would have bought without a reminder. Predictive analytics can provide better evidence, but it must first show value over your existing rule. Start with a decision and evaluation on later data.
01Start with a decision you want to improve
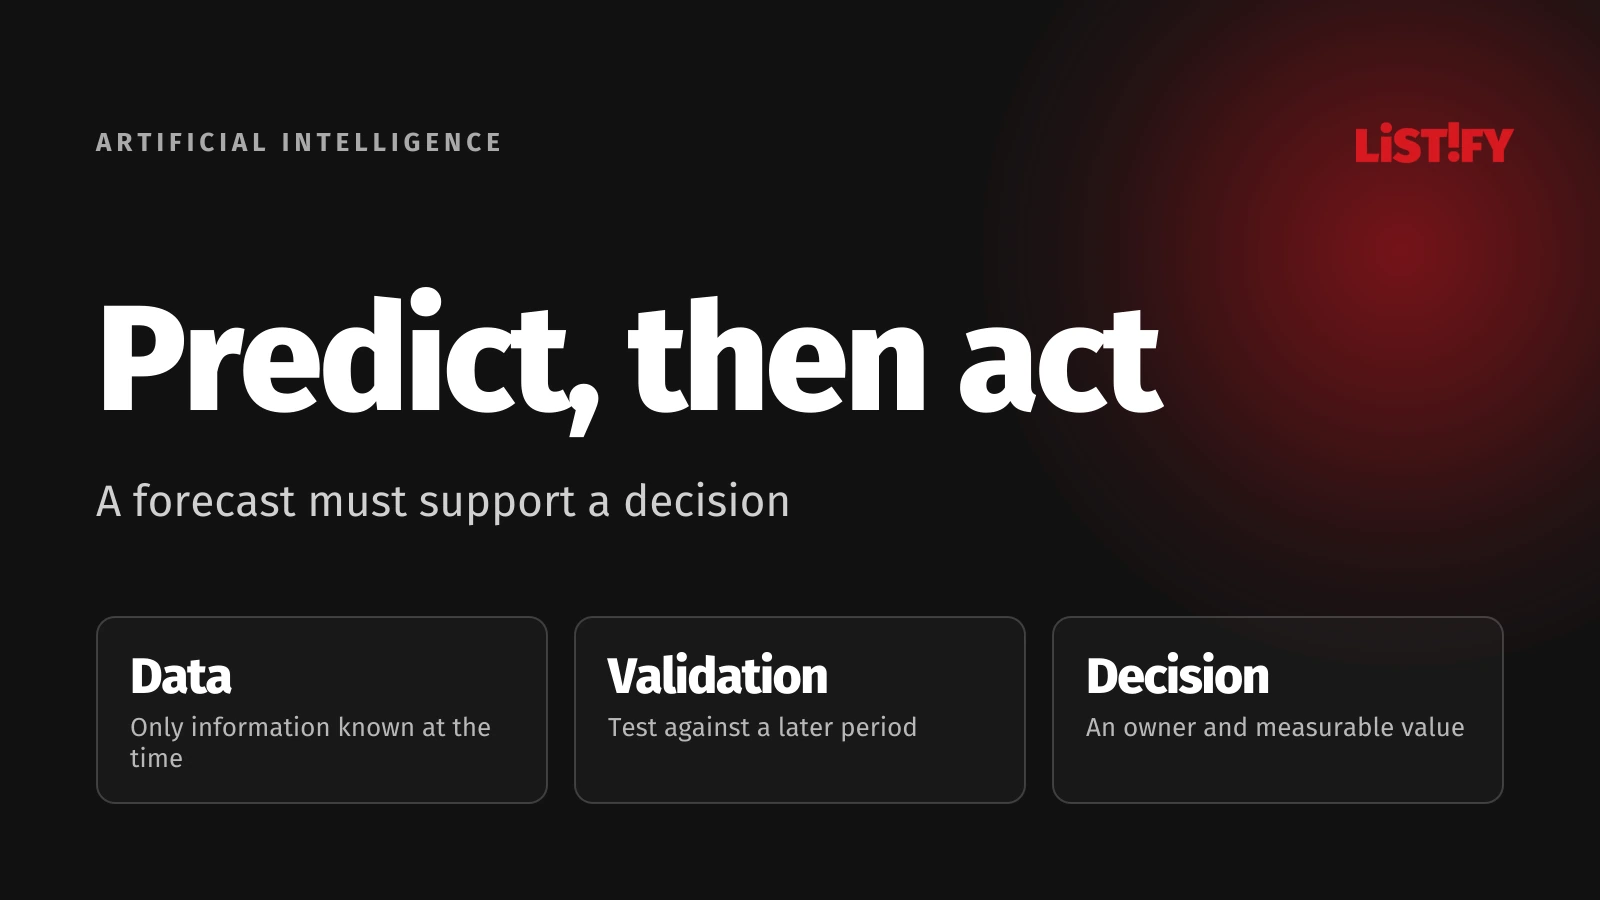
Predictive analytics estimates a future value or the probability of an event from available data. It helps a business when someone can act on the result in time. First identify who receives the estimate, which decision they make and how much notice they need.
A buyer working with a month-long lead time needs more than tomorrow’s forecast. A support manager needs an estimate of work during a shift, not annual website visits. A salesperson needs an explained list of worthwhile calls and the capacity to actually make them.
Choose one output for the first project: weekly demand for a product group, for example, or the probability that an active customer will not purchase during the next period. Define the calculation time, forecast horizon and outcome. “Predict customers using AI” is too broad to guide either development or evaluation.
02Separate customer behaviour from demand volume
Customer churn prediction and order forecasting answer different questions. For a customer, you assess a future event and its probability. For demand, you estimate an amount over time. They need not share the same data, model or success measure.
| Task | Output | Following decision |
|---|---|---|
| Churn risk | Risk under a specified definition and period | Whom to contact and what help to offer |
| Purchase propensity | Estimated purchase probability within a horizon | How to allocate limited sales capacity |
| Product demand | Units by week and product group | How much to order and when |
| Support workload | Ticket volume or required effort | How to plan shifts and cover |
Clarify what is being measured. Sales are not always demand: zero sales for an unavailable product do not establish zero interest. Record availability, cancelled orders, returns and known promotions. Otherwise you may accurately predict the company’s historical constraints instead of customers’ needs.
03Reconstruct what was known at the time
A record may need both an event date and the time the information became available in the system. A retrospectively corrected invoice or later review may not have been known when the original decision was made. The historical view should match what the application could actually have seen.
Scikit-learn describes using information unavailable at prediction time as data leakage. It produces overly optimistic results. Split data before learning preprocessing; filling missing values and selecting inputs must not learn from the test portion either.
For example, suppose you predict customer churn at the start of a month. A later account cancellation date cannot be an input. Even a “contacted by retention team” field is not automatically valid if it was created after the prediction date. Document each input’s origin, availability and update process.
Connect orders, stock and CRM records before choosing a complex model. You first need to identify the same customer and product across systems. That is a concrete task for integrations and APIs. Select personal information according to the purpose and restrict access to the roles that need it.
When assembling history from older sources, check the common mistakes in data migration from Excel or a legacy system.
04Test a future the model has not seen
Randomly mixing records that follow each other in time can create an unrealistic test. The principle behind scikit-learn’s time-based splitting is to learn from earlier data and evaluate on later data. Design the split around your actual decision calendar.
Repeat the process from several historical starting points, always forecasting the same horizon. Keep the final untouched period for a final check. If a customer’s outcome takes thirty days to observe, exclude training cases whose outcomes would not yet have been known at that point. Leave a gap between periods where the task requires it.
If you will use the model for new customers or products, evaluate those groups separately. Performance on returning customers does not automatically transfer to new ones. Check seasons, promotions and branches with limited representation as well. A single average can hide the very error that causes the greatest operational difficulty.
05Compare the model with a simple rule
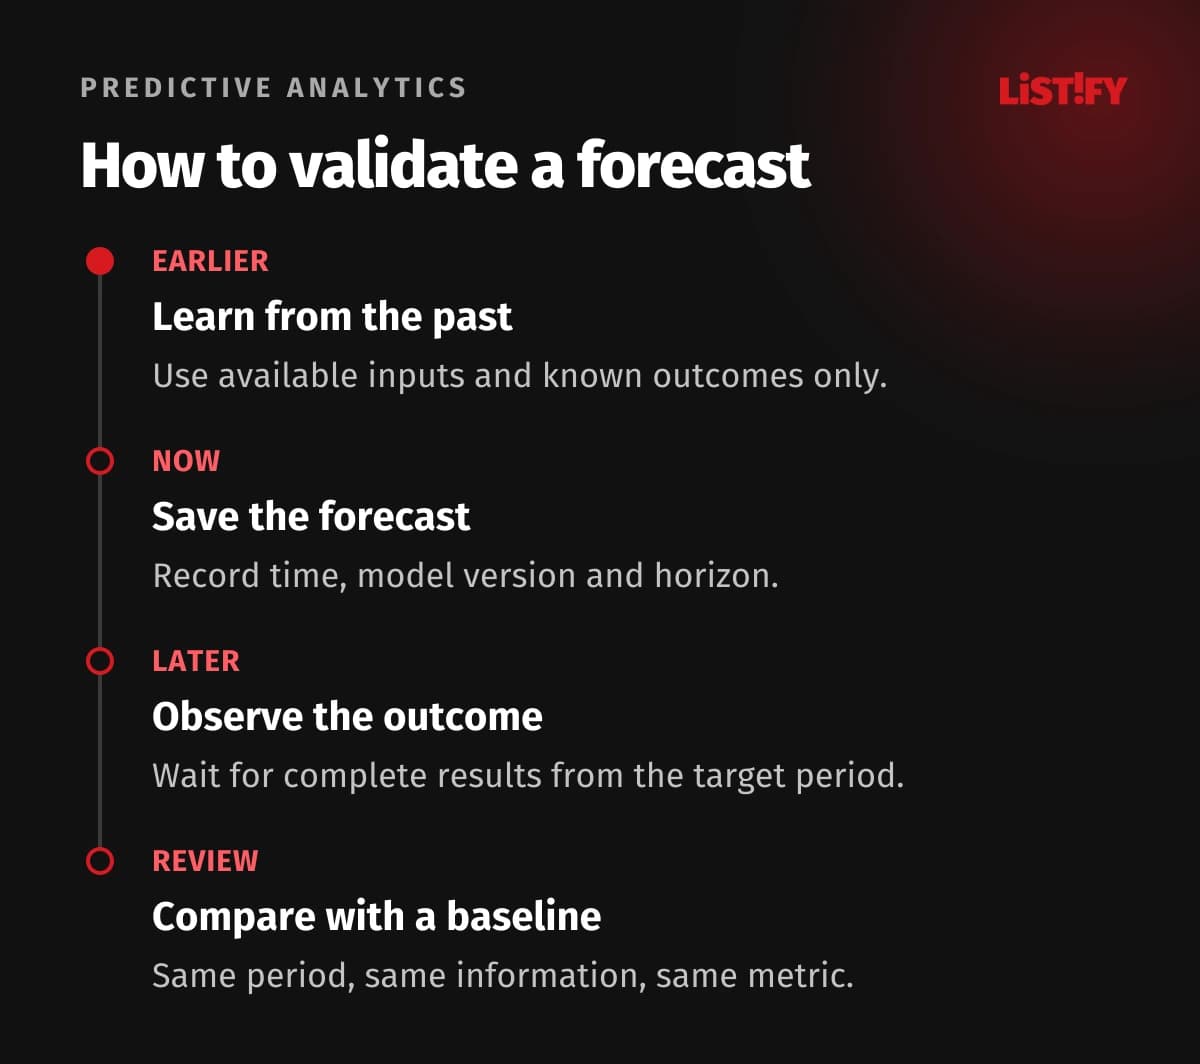
Establish a baseline first, such as the last comparable week or the buyer’s existing procedure. Then test more complex models. Evaluate the same periods, products and information available when each prediction was made.
The following figures are a purely illustrative calculation, not client results or measured algorithm performance. Assume four successive weekly forecasts for one product group. Each forecast is made before its corresponding week. All values are units.
| Week | Actual | Simple estimate | Candidate model |
|---|---|---|---|
| 1 | 100 | 90 | 100 |
| 2 | 120 | 100 | 110 |
| 3 | 80 | 100 | 90 |
| 4 | 100 | 110 | 100 |
Mean absolute error, or MAE, averages the size of errors without their signs. The simple estimate produces (10 + 20 + 20 + 10) / 4 = 15 units. The candidate produces (0 + 10 + 10 + 0) / 4 = 5 units. Yet actual demand and both forecast totals are 400 units. Checking the total alone would miss the problem.
Four weeks are insufficient for a deployment decision. The example explains a metric. In practice, distinguish shortages from surpluses because they incur different costs. For customer models, assess the quality of contacts within the number your team can approach, alongside the cost of unnecessary and missed interventions.
- Simple estimate15
- Candidate model5
Illustration using the 4 weeks in the table. MAE is the mean absolute error of weekly values. Lower is better; these are not measured model results.
06Show uncertainty and test the effect of acting
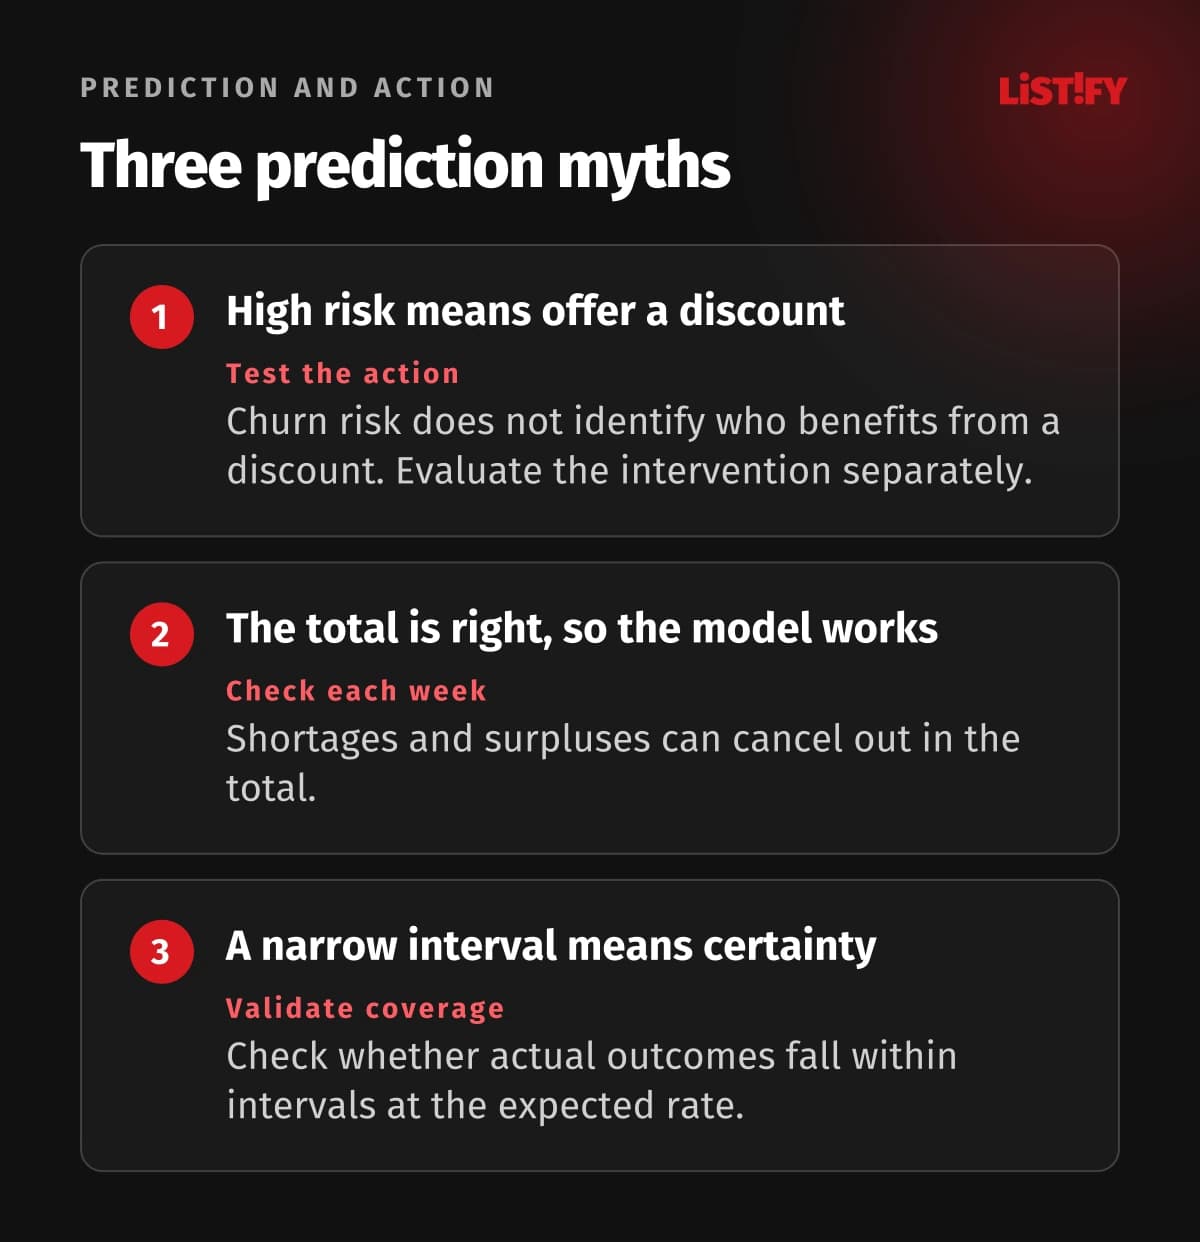
A point estimate alone gives the buyer an incomplete picture. Hyndman and Athanasopoulos describe prediction intervals as a way to express uncertainty about a future value. State their coverage level and check whether actual outcomes fall within them at the intended rate.
A narrow interval is not automatically a good one; it may underestimate uncertainty. Agree what to do when the range is wide enough to change the purchasing decision: order a smaller quantity, request human review or obtain fresher data. A prediction should support a decision even when the result is ambiguous.
Churn risk also does not identify who will benefit from a discount. A high-risk customer may not respond, while a low-risk customer might buy without any offer. Where operations allow, test the effect of contact using a properly designed control group. Do not automatically attribute a post-campaign change to the model.
07Run a pilot with an owner and a fallback
Initially, let the model produce recommendations alongside ordinary decision-making. Record the prediction time, inputs, model version, human decision and eventual outcome. This provides evidence of whether the system adds useful information and how much work checking it requires.
Google’s machine learning guidance highlights differences between training and production. Monitor input freshness and consistency of calculation. A new price list, changed measurement or missing stock export can degrade the result without any model change.
Assign responsibility for missing data, approval of new versions and switching back to the simple rule. Include operations, retraining and people’s time in the cost. If the candidate adds no useful value over the baseline, keep the simpler solution. Base further AI adoption in your business on the pilot’s demonstrated outcome.
When evaluating the pilot, separate expected benefits from demonstrated value using our guide to calculating software ROI.
08Frequently asked questions
How much historical data do we need?
It depends on event frequency, seasonality and the forecast horizon. Row count alone is insufficient. You also need enough observed outcomes and a period reserved for independent evaluation.
Does predictive analytics require complex AI?
No. A simple rule or statistical model may be more suitable if it is easier to validate and supports the same decision at lower cost.
Does a churn probability mean a customer will definitely leave?
No. It is an estimate for a defined event and period. Check how well it corresponds to actual outcomes within relevant customer groups.
Can forecasts place purchase orders automatically?
Only after validating results and setting limits, ownership and a fallback. Begin with recommendations for a person, and separate forecast quality from purchasing decision quality.
09Choose one prediction you can act on
Send us an example decision, available data sources and your current estimation method. Discuss a predictive analytics pilot with us, with a clear horizon, baseline and evaluation rules.