Logging and observability: connect metrics, logs and traces
The service is running, but customers cannot finish a checkout. CPU graphs look normal, logs contain thousands of messages and nobody can follow the failed request across systems. Observability becomes useful when those signals help the team answer what is affected, where work failed and what to do next.
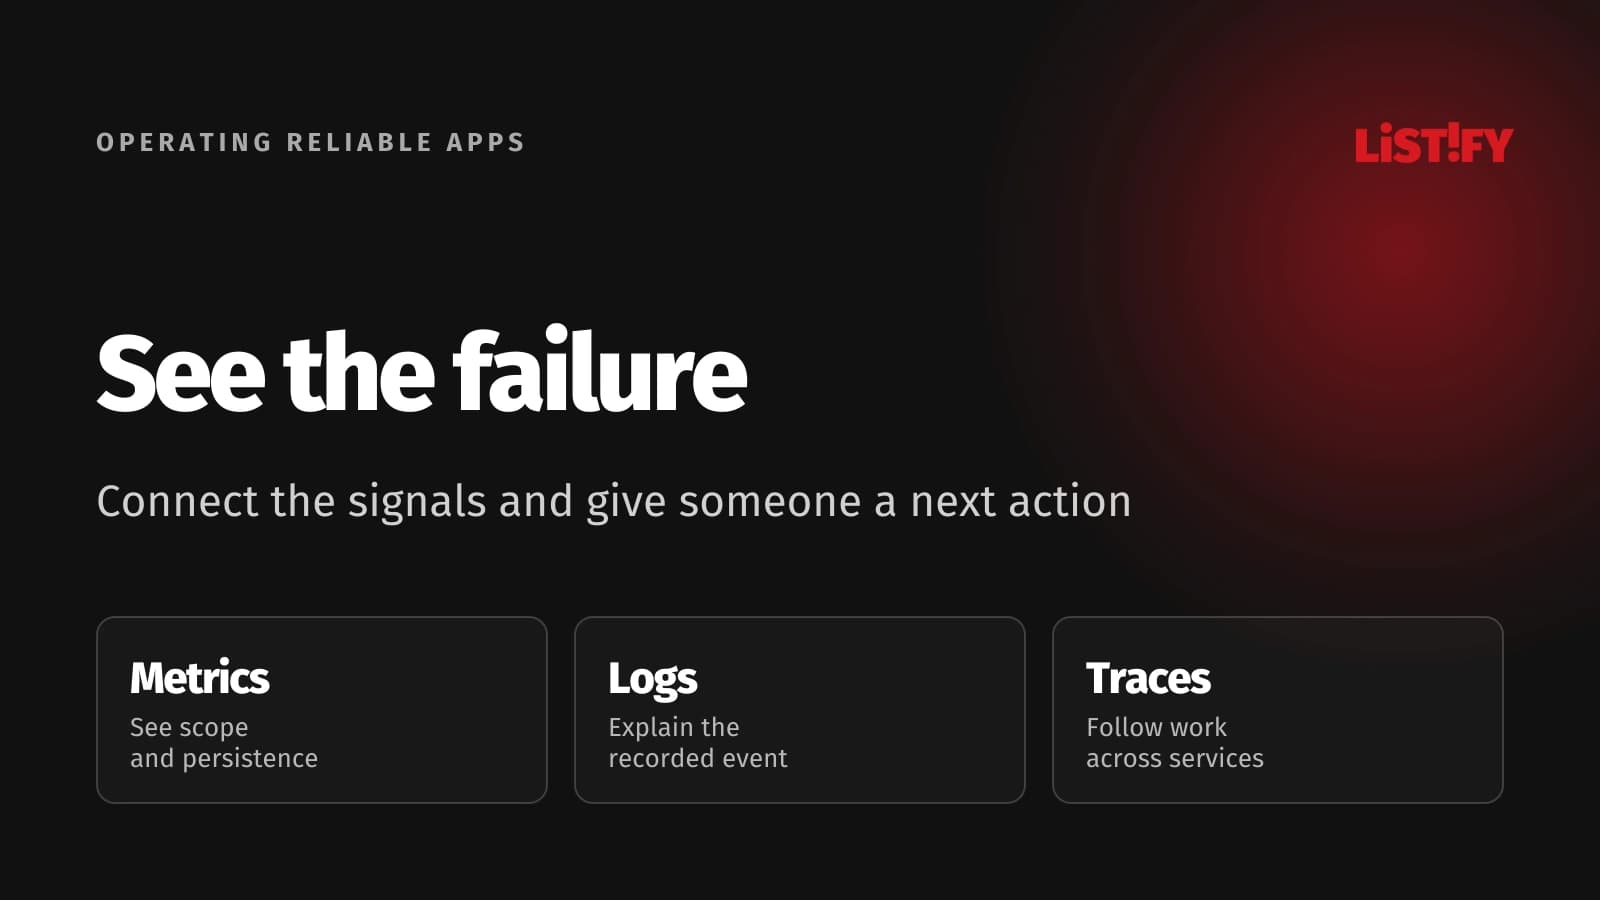
Start with a customer journey and a failure question, then choose the telemetry needed to investigate it. Installing several monitoring tools can create more screens without making a production incident easier to understand.
For a booking application, the important journey might run from availability search through reservation and confirmation. A successful HTTP response at the first step does not establish that the booking completed. Instrument the technical path and the relevant business outcome.
01Give each signal a clear job
OpenTelemetry’s signal overview describes metrics, logs and traces as complementary telemetry. Metrics summarize measured behavior, logs record events and traces represent the path of work through instrumented operations. Use the signal that answers the question rather than copying everything into every tool.
| Signal | Useful question | Example | Practical limit |
|---|---|---|---|
| Metrics | How widespread or persistent is the problem? | Reservation failures and latency distribution | Aggregation may hide the individual request |
| Logs | What happened at this point? | Structured reservation rejection with a safe reason code | Unstructured noise is difficult to correlate |
| Traces | Where did the operation spend time or fail? | Search, reservation and provider-call spans | Missing instrumentation or sampling limits coverage |
| Outcome checks | Did the customer task succeed? | A reservation exists and confirmation was scheduled | Business meaning must be explicitly defined |
Use metrics to locate an affected period or operation, then follow relevant traces and logs for explanation. A dashboard should make that path practical. If every investigation begins by manually matching timestamps in three systems, improve the shared context.
Keep infrastructure health alongside customer outcomes. Resource use and saturation can explain a failure, but a server that is technically up can still return unusable results. Define successful work in the language of the product.
Separate observability from a complete security-monitoring program. Application telemetry can support an investigation, but detection rules, security ownership and response procedures need their own design. A searchable log store alone does not establish those capabilities.
02Choose useful metrics and control their dimensions
Measure request volume, error outcomes, latency and resource constraints for important services. Include asynchronous work such as queue age, processing failures and unfinished jobs. A booking can succeed in the request handler and fail later when the confirmation job runs.
Define the numerator, denominator and relevant exclusions for each rate. Distinguish expected user errors, unavailable inventory and internal faults where that distinction changes the response. Combining every unsuccessful request into one undifferentiated total can send the team toward the wrong cause.
Use distributions for response time instead of relying solely on the average. A minority of very slow requests can affect important customers while the average looks acceptable. Record the percentile and observation window so comparisons preserve the same meaning.
Prometheus naming and label guidance explains that each unique combination of labels creates a time series and warns against unbounded values such as user identifiers. Use a stable route template instead of one metric series per full URL or reservation number.
Choose bounded dimensions that support operational decisions: service, environment, operation, outcome and release are common candidates. Review how combinations grow. A seemingly modest label can multiply storage and query cost when combined with others.
Make the dashboard show scope and freshness. Users need to know whether they are looking at production, one region or an old interval. A clean visual without that context can make a partial recovery look like a complete one.
03Write structured logs that explain events safely
Give important events consistent fields: event name, timestamp, severity, service, environment, release, safe outcome code and correlation context. Prefer controlled values to messages that embed changing text. Structured fields make filtering and analysis less dependent on fragile string searches.
Log meaningful state changes and failures at a level the team can use. Routine repetition can bury the event that matters. Decide which successful events need detail and which are better represented by a metric, then adjust verbose diagnostics deliberately.
OWASP logging guidance discusses security-relevant events, sensitive data exclusions and log protection. Avoid recording passwords, access tokens and unnecessary personal content. Scrub or exclude sensitive information before it enters the telemetry pipeline where practical.
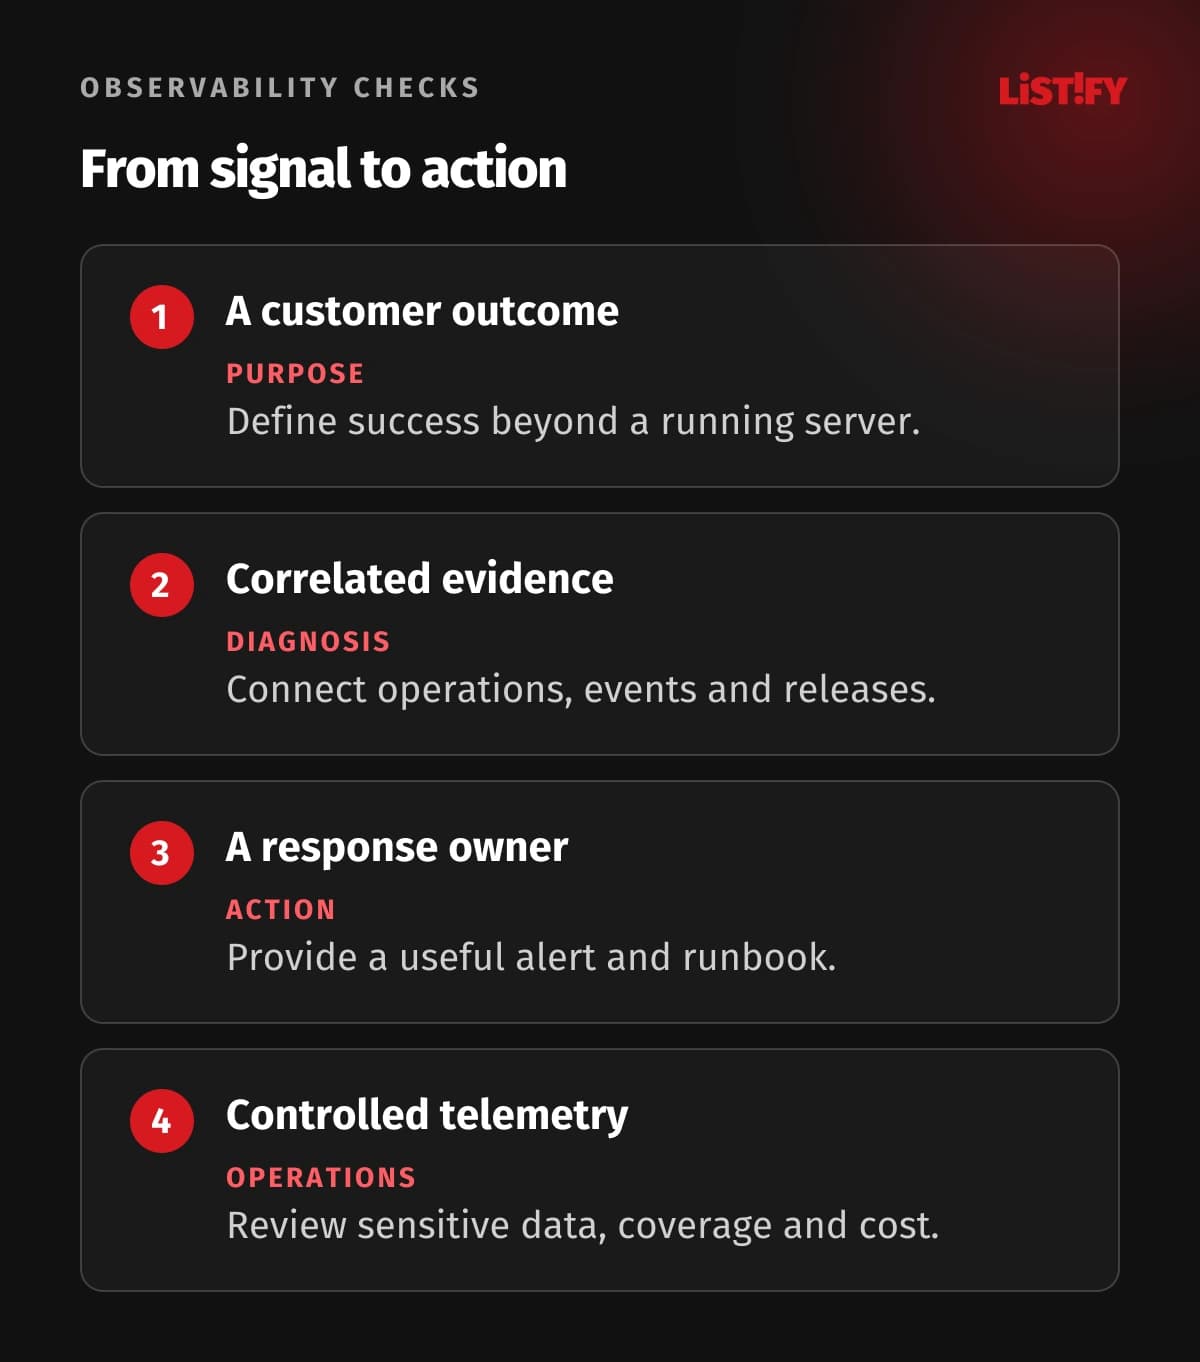
Prevent untrusted input from creating misleading log entries. Use the logging library’s structured facilities and safe handling for control characters. A support message or URL should not be able to masquerade as a new system event.
Restrict access and define retention by purpose. Logs can contain customer-linked identifiers even when they omit names. Investigators need useful context, while ordinary application users and unrelated staff should not gain broad access to production details.
Keep audit history requirements explicit. A debug log that rotates frequently and can be edited by administrators is not automatically a suitable record of every sensitive business decision. Choose the record and protection appropriate to that purpose.
04Trace the path across services and background work
OpenTelemetry trace documentation describes spans and their relationships within a trace. Instrument significant operations so the path reflects the work your team needs to diagnose, rather than merely creating a span around every tiny function.
Propagate context across HTTP calls, queues and worker boundaries where supported. Preserve the relationship when a booking service schedules a confirmation job. An unrelated trace for every step makes it harder to see that a downstream failure belongs to the same customer operation.
Keep service names, environment and release attributes consistent. An incident investigator should be able to find the version serving the affected request. Treat a missing or conflicting resource name as an instrumentation defect, not simply a naming preference.
Add trace context to relevant logs so the team can move from a span to the event details. Maintain a separate business reference when the workflow spans multiple attempts or longer-lived processes. Do not assume one short request trace captures the entire lifecycle of an order.
Handle external services honestly. You may observe the time and outcome of a provider call without visibility into the provider’s internal spans. Show that boundary and retain safe response context instead of suggesting the trace explains what happened inside an uninstrumented system.
The API integration guide connects this visibility with retries and dependencies. A retry can recover a transient fault while also masking repeated delay; make both the attempts and final outcome understandable.
05Alert on impact with a named response
An alert needs a condition, severity, owner and useful next action. Separate an urgent page from a nonurgent investigation item. If every capacity fluctuation wakes the same person, the team will struggle to distinguish the event that actually requires immediate action.
Define a service-level indicator for important customer behavior and a service-level objective for an agreed window. The objective describes the reliability you aim to deliver. The difference between that objective and perfect service provides an error-budget concept for managing failure.
Google’s SRE workbook chapter on SLO alerting explains alerts based on how quickly the error budget is consumed. Use the approach to connect urgency to sustained user impact rather than copying thresholds without considering traffic and the service objective.
A runbook should explain how to confirm scope, inspect recent changes, identify likely dependencies and mitigate safely. Include the relevant dashboard and escalation path. Test the instructions with someone other than the author to find hidden assumptions.
Review no-data conditions as well as bad values. A stopped collector or missing metric can make a dashboard appear quiet while the application is failing. Decide which absence of telemetry needs an alert and avoid treating missing data as a successful result.
After incidents, remove noisy or duplicate alerts and add missing evidence that would have shortened diagnosis. The aim is a dependable response path, not a continuously growing list of thresholds.
06Control sampling, pipeline reliability and cost
OpenTelemetry sampling guidance distinguishes decisions made early from decisions based on collected trace information. Select a policy for your traffic and diagnostic needs. Sampling reduces coverage, so document what an absent trace does and does not prove.
Do not promise that every failed operation will be retained unless the actual pipeline supports and verifies that guarantee. A failure can occur after an early sampling decision, or telemetry can be dropped before later selection. Test the policy with representative failure paths.
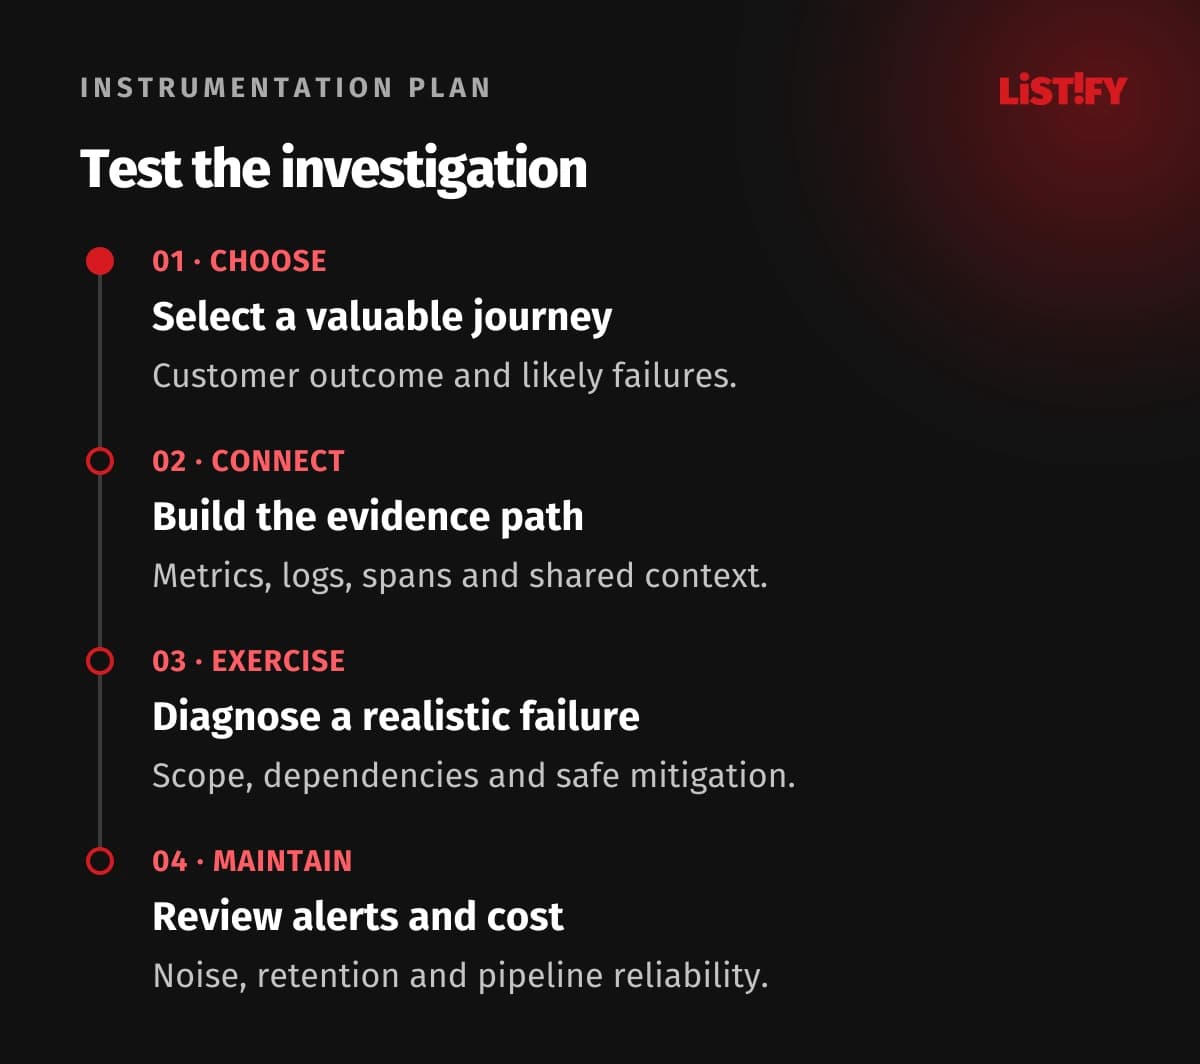
Monitor the telemetry system itself: queues, exporter failures, dropped records, ingestion delays and storage limits. Decide how application behavior should respond if telemetry is unavailable. Ordinary diagnostics should not unexpectedly block a customer’s main task.
Set retention and detail by the information’s purpose. Recent diagnostic events may need a different policy from long-term service trends or audit evidence. Compare cost with the questions the retained data can actually answer.
The scalability guide provides related operating context. Include telemetry load in capacity planning and inspect changes after releases that add new event fields or metric dimensions.
Exercise an incident scenario before expanding. A teammate should identify the affected journey, find the relevant evidence and follow the response without asking where the logs live. That practical check is a stronger acceptance criterion than merely seeing data arrive.
07Questions about logging and observability
Do we need metrics, logs and traces from the start?
Use what the critical journey needs. Metrics and useful structured logs often provide an initial foundation; traces become especially valuable across dependencies. Build a complete investigation path before collecting every signal everywhere.
Is OpenTelemetry a monitoring dashboard?
It supplies instrumentation and telemetry capabilities that can connect with collection and analysis systems. You still need suitable storage, querying, visualization and response ownership. Installing an SDK alone does not create the operating process.
Should customer IDs be metric labels?
Unbounded identifiers can create excessive series and expose unnecessary data. Use bounded operational dimensions for metrics and carefully controlled correlation data in appropriate diagnostic records. Review privacy and access as well as cost.
Why is an average response time insufficient?
It can hide a subset of very slow operations. Examine an appropriate distribution, percentile and time window, then connect the delay to the affected journey. Keep the same definition when comparing releases.
Does a missing trace mean the request did not happen?
No. Sampling, incomplete instrumentation or pipeline loss can remove visibility. Document the collection policy and inspect supporting metrics and business records before concluding that the operation never occurred.
Which alerts should wake someone?
Use conditions that require timely action, with a named responder and useful runbook. Relate urgency to customer impact and the service objective. Route nonurgent trends to planned investigation rather than treating every fluctuation equally.
What proves a first implementation works?
Run a realistic failure scenario and have a teammate diagnose it. Confirm the customer outcome, correlated logs and spans, alert ownership and response steps. Also check sensitive-data exclusions and visibility into telemetry failures.