UX metrics: How to use SUS, NPS, CSAT and task completion
The survey looks positive, but people still cannot complete an order. Each metric describes a different part of the experience. Here is when to use SUS, NPS, CSAT and task completion, how to calculate them and what the results can actually support.
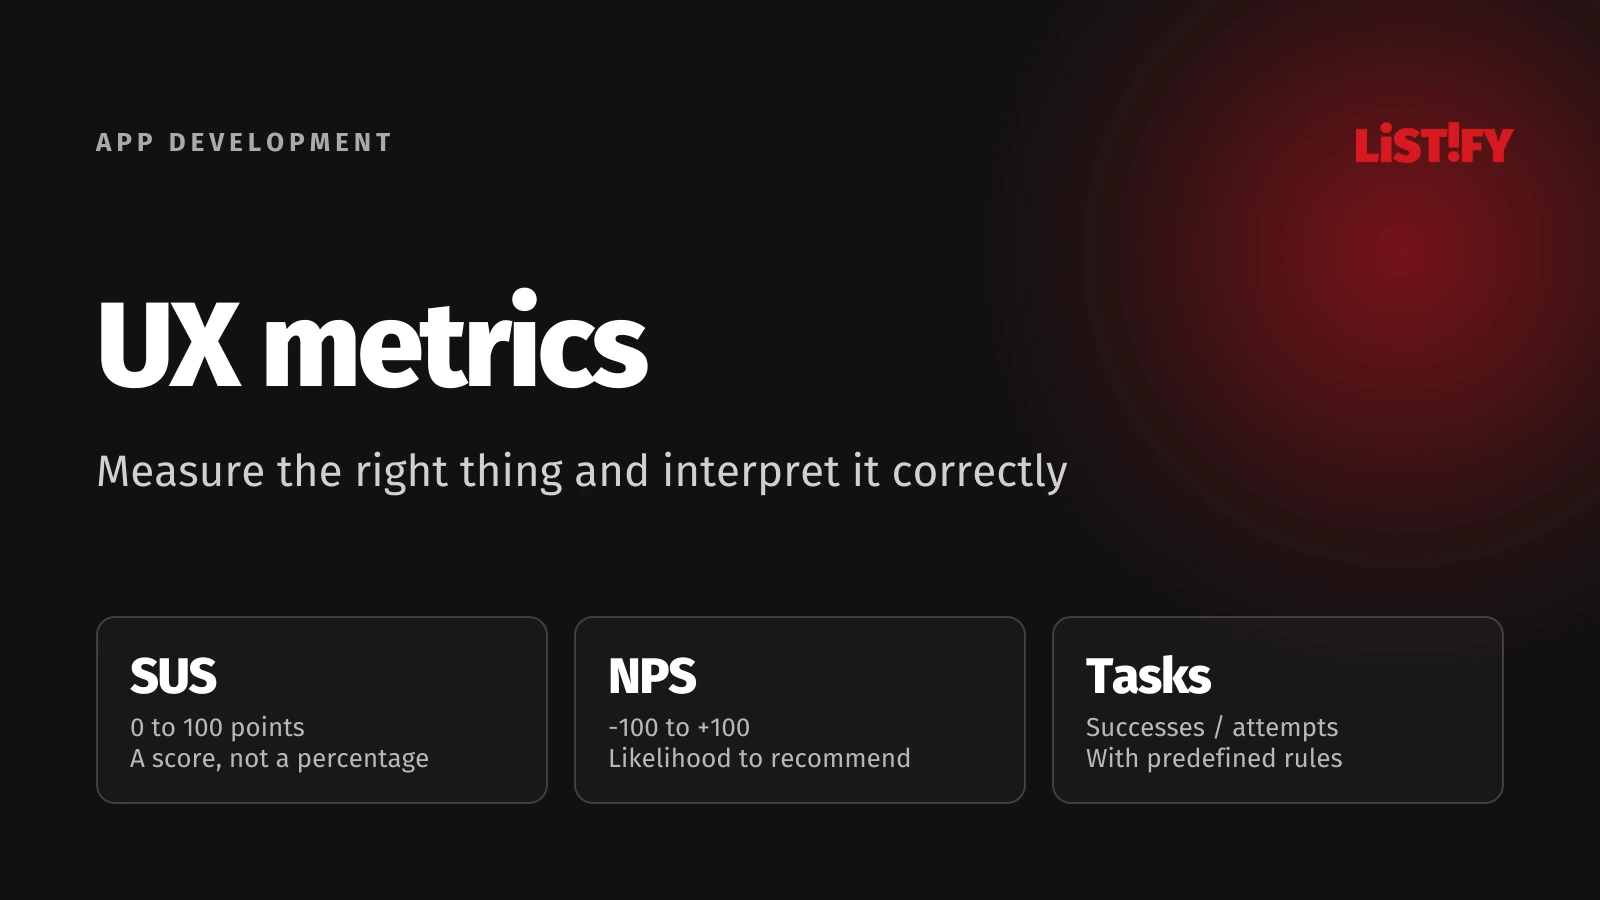
01Choose the question before the metric
Do you want to know whether people can change a booking, how they perceive the application's usability, or whether they would recommend the service? These are different questions. Do not average SUS, NPS, CSAT and task completion into a single “UX score”. Their scales, denominators and meanings differ. One attractive number would hide the problem you need to fix.
For a new feature, begin by observing a real task. Use a standardised questionnaire to assess perceived usability, satisfaction for a defined interaction and likelihood to recommend for a broader relationship. This article builds on our UX prototype design checklist by focusing on measurement choices and interpretation.
02Four metrics answer four different questions
| Metric | What it describes | Output | What it cannot establish alone |
|---|---|---|---|
| SUS | Perceived system usability after use. | A score from 0 to 100. | The percentage of successful tasks or satisfied people. |
| NPS | Stated likelihood of recommending a product or service. | A score from -100 to +100. | The cause of a problem on a particular screen. |
| CSAT | Satisfaction with a defined experience. | Under the stated calculation, the share of satisfied responses. | The ability to complete a task without help. |
| Task completion | The observed result of specific work. | The share of successful attempts under the study's rules. | Satisfaction or the reason for failure. |
03SUS: A usability score, not a percentage
The System Usability Scale uses ten items with responses from 1 to 5, completed after using the system. John Brooke's original method specifies the scoring: subtract 1 from odd-item responses, subtract even-item responses from 5, add those contributions and multiply by 2.5.
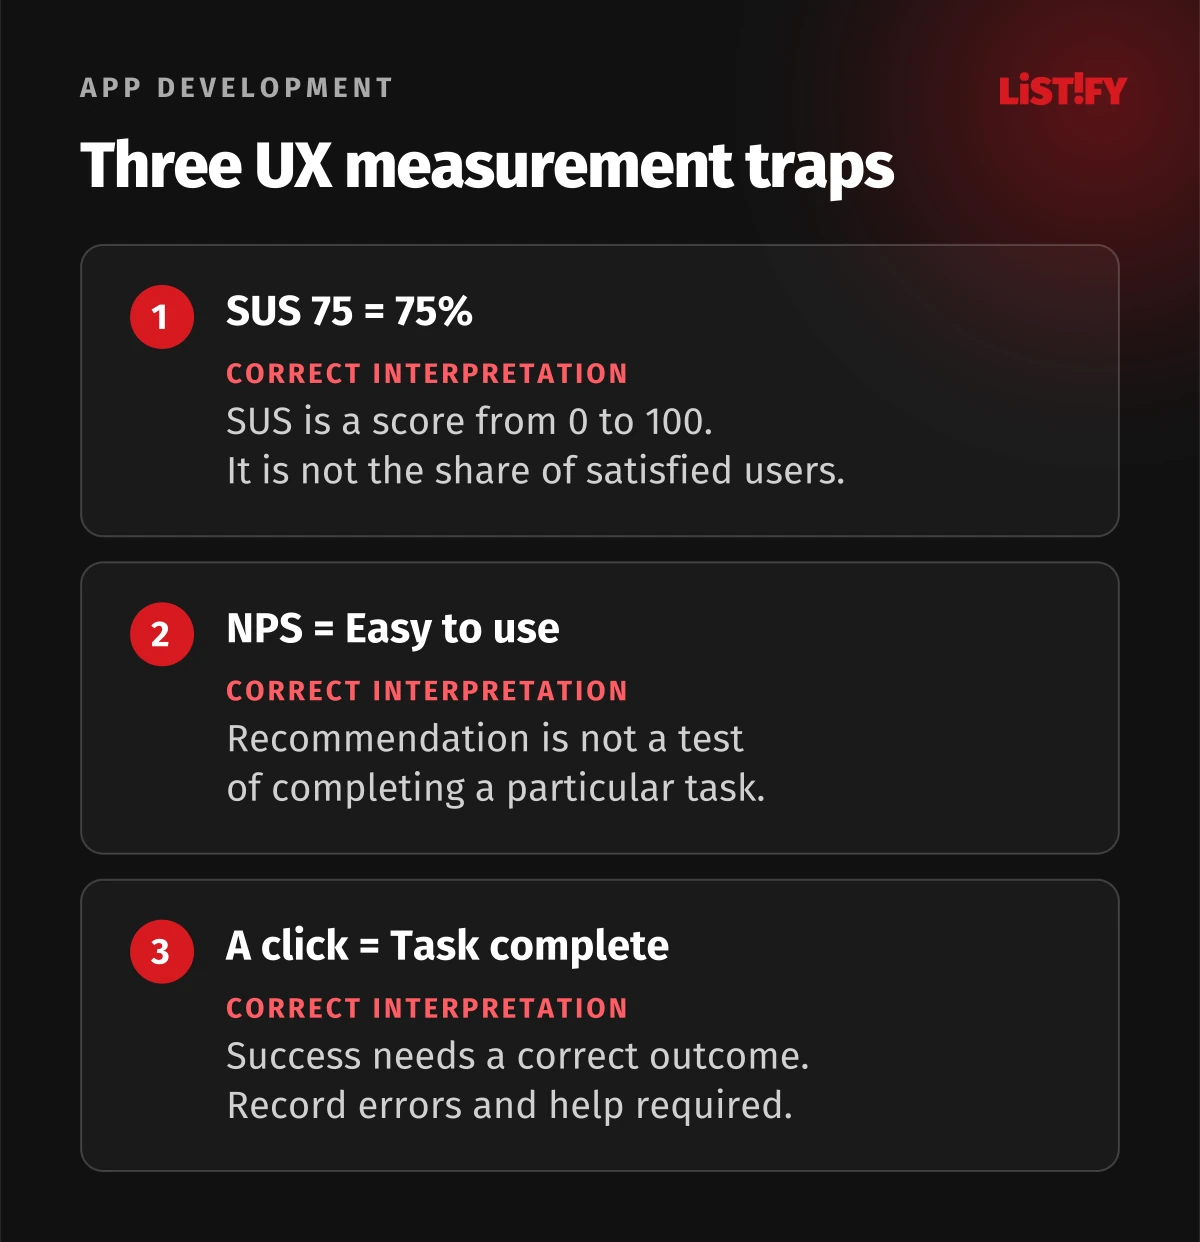
Worked example: One person's responses are 4, 2, 4, 2, 4, 2, 4, 2, 4, 2. Each contributes three points, giving a total of 30, so SUS = 30 × 2.5 = 75. That does not mean “75% usable”. The transformed score is not a proportion of people or tasks. For a group, calculate each participant's score first, then describe the aggregate and its spread.
Use the standard wording and a suitably validated language version. Freely rewriting an item or removing an inconvenient question changes the instrument. Do not automatically replace missing answers with zero; agree a missing-data rule based on your chosen methodology before collection. Item direction and scoring are also described by Lewis and Sauro's study of SUS factor structure.
We recommend SUS for comparisons of the same product under similar conditions. Record what people actually used before completing it. Scores from experienced staff after a year of work cannot simply stand in for scores from newcomers after a first trial.
04NPS: Recommendation is not a screen-level test
Bain specifies a likelihood-to-recommend scale from 0 to 10. Scores of 9 or 10 are promoters, 7 or 8 are passives, and 0 to 6 are detractors. NPS subtracts the percentage of detractors from the percentage of promoters, producing -100 to +100. Passives remain in the denominator.
In a model of 100 valid responses, there are 40 promoters, 35 passives and 25 detractors. NPS = 40 - 25 = +15. Report +15 as a score, not as 15% satisfaction. Different distributions can also produce the same NPS, so retain the group breakdown and response count.
Specify whether people are evaluating a brand, product or particular experience. Do not silently mix those contexts in comparisons. Include space for an explanation and decide who will analyse the comments. NPS should not be the only acceptance criterion for a new form: price, delivery and previous interactions can all affect the customer's judgement.
05CSAT: Define the experience being rated
CSAT measures satisfaction with a defined experience. A common five-point version calculates the share of valid responses scoring 4 or 5; this is the approach described by Qualtrics. Save the question, scale labels, invitation timing and rule for classifying a response as satisfied.
In a separate illustrative survey of 100 respondents, 32 select four and 40 select five. CSAT = (32 + 40)/100 × 100 = 72%. The denominator is not everyone invited. If 500 people received the questionnaire, the response rate is 100/500 = 20%, a different measure.
Label an average of 4.2 out of 5 as an average rating, not as the same CSAT calculation. Changing the scale or question timing creates a break in the trend. A survey sent after a support request closes also misses people who never managed to contact support. Describe who has an opportunity to respond and who is absent from the data.
06Task completion: Define success first
Task completion measures successful attempts at a defined task. Nielsen Norman Group distinguishes complete and partial success. We recommend separate categories for completion without help, completion with help and non-completion. Do not turn those labels into an arbitrarily weighted score.
“Change a booking” must include the correct date, the correct person and a saved confirmation. Clicking a button does not prove success. Specify a time limit, permitted assistance, treatment of technical interruptions and repeat attempts in advance. If a participant never starts, explain why and how that affects the denominator.
In an example, eight of ten people finish without help: 80%. If a moderator helps one more person, independent completion remains 80%, while completion including assistance is 90%. Keep those measures distinct. Report different tasks separately so easy information retrieval cannot hide a failed payment flow.
07Add time, errors and explanations
For an important task, record error types, the critical step and assistance required. Measure time from a consistent start to a consistent finish. Distinguish successful attempts, unsuccessful attempts and interruptions. Silently excluding unfinished tasks can make a product appear faster precisely because some people gave up.
During qualitative testing, ask what a person expects and what they do not understand. If they describe their thoughts aloud, do not compare their time without qualification with ordinary silent use. Observation suggests causes you can investigate. “CSAT went down” does not, by itself, identify the part of the application to redesign.
08Worked chart: Compare the same measure
The following is an illustrative model of two variants, not an experiment or LISTIFY results. Assume 20 participants per variant and one attempt by every participant at each of three tasks. All attempts are included. Success means correct completion without assistance.
| Task | Variant A | Variant B |
|---|---|---|
| Create a request | 12/20 = 60% | 16/20 = 80% |
| Correct a detail | 15/20 = 75% | 17/20 = 85% |
| Find the status | 16/20 = 80% | 18/20 = 90% |
Creating a request differs by 20 percentage points, a relative increase of approximately 33.3%. The chart shows one comparable measure with an explicit denominator. It does not put SUS 75, NPS 15 and CSAT 72% beside each other as though bar length represented the same quantity. The model supports no claim of statistical significance or causation.
- Create a requestVariant A: 60%Variant B: 80%
- Correct a detailVariant A: 75%Variant B: 85%
- Find the statusVariant A: 80%Variant B: 90%
Illustrative model, not an experiment or client data. Each variant has 20 participants, each attempting every task once. A: 12, 15, 16 successes; B: 16, 17, 18. Correct completion without help. No claim of significance or causation.
09Check participant selection and uncertainty
Report the participant count, recruitment method, role, device and observation period alongside every result. A small study can reveal a serious defect without estimating a population percentage precisely. Eight successes out of ten and eighty out of one hundred have the same point estimate, but the evidence and uncertainty differ.
When comparing versions, plan sample size around the expected difference and an appropriate statistical method. Uncertainty is not calculated identically for proportions, NPS and average SUS. Repeated testing of the same person introduces learning and dependence between observations. Random assignment helps separate design effects from differences in group composition.
Do not compare newcomers on phones with trained employees on desktop computers without explanation. Even a large response count cannot remove systematic exclusion of unhappy customers who already left. Use benchmarks where context and methodology are comparable. A universal threshold for “good UX” cannot replace your product's requirements.
10Write a one-page measurement plan
- Decision: What will you change or approve based on the findings?
- Task and audience: Who handles which situation, on which device?
- Metric: The calculation, scale, denominator and exception rules.
- Collection: Who is invited, when, what is recorded and who can access it.
- Baseline: The product version and conditions to preserve.
- Analysis: Sample size, uncertainty, segments and limitations.
- Action: A fix owner, a deadline and a comparable follow-up check.
Pilot both the questionnaire and the calculation before collection. Try blank answers, extreme values and duplicate submissions. For an analytics event, verify that it fires after actual completion rather than when a button appears. Do not change the rules retrospectively just because the first result looks disappointing.
11Common questions about UX metrics
Does SUS 75 mean 75% satisfaction?
No. SUS is a transformed questionnaire score from 0 to 100. It is not the percentage of satisfied people, successful tasks or the percentile achieved.
Can we use NPS alone?
For tracking likelihood to recommend, yes. It is insufficient on its own for assessing the usability of a new feature. Add completion of a specific task and observations that explain problems.
How many respondents do we need?
That depends on the question, required precision, difference of interest and study design. Small studies can help find problems. For precise score comparisons, plan the sample rather than relying on one universal number.
Want to establish whether a new feature is easier to use? In web application design and development, start with one important task, a clear success criterion and a repeatable measurement plan. Findings should lead to a specific improvement, not just another number on a dashboard.